Try New Data
This feature helps you evaluate the accuracy of a trained model against either a pre-labeled dataset or a blind dataset. This process helps identify the model's strengths and weaknesses, refine it further, or gather insights for decision-making.
Train > Try New Data allows you to use a sample list containing new data to see how a trained tool performs. Run an Accuracy Test to generate a confusion matrix showing the accuracy of predictions on the sample list contents. Run a Performance Test to gauge the response time of a cloud API. The Accuracy Test is most useful for testing a trained tool against new data collected from the field. Run the test, investigate errors, then add any misclassified data to the training set and retrain.
-
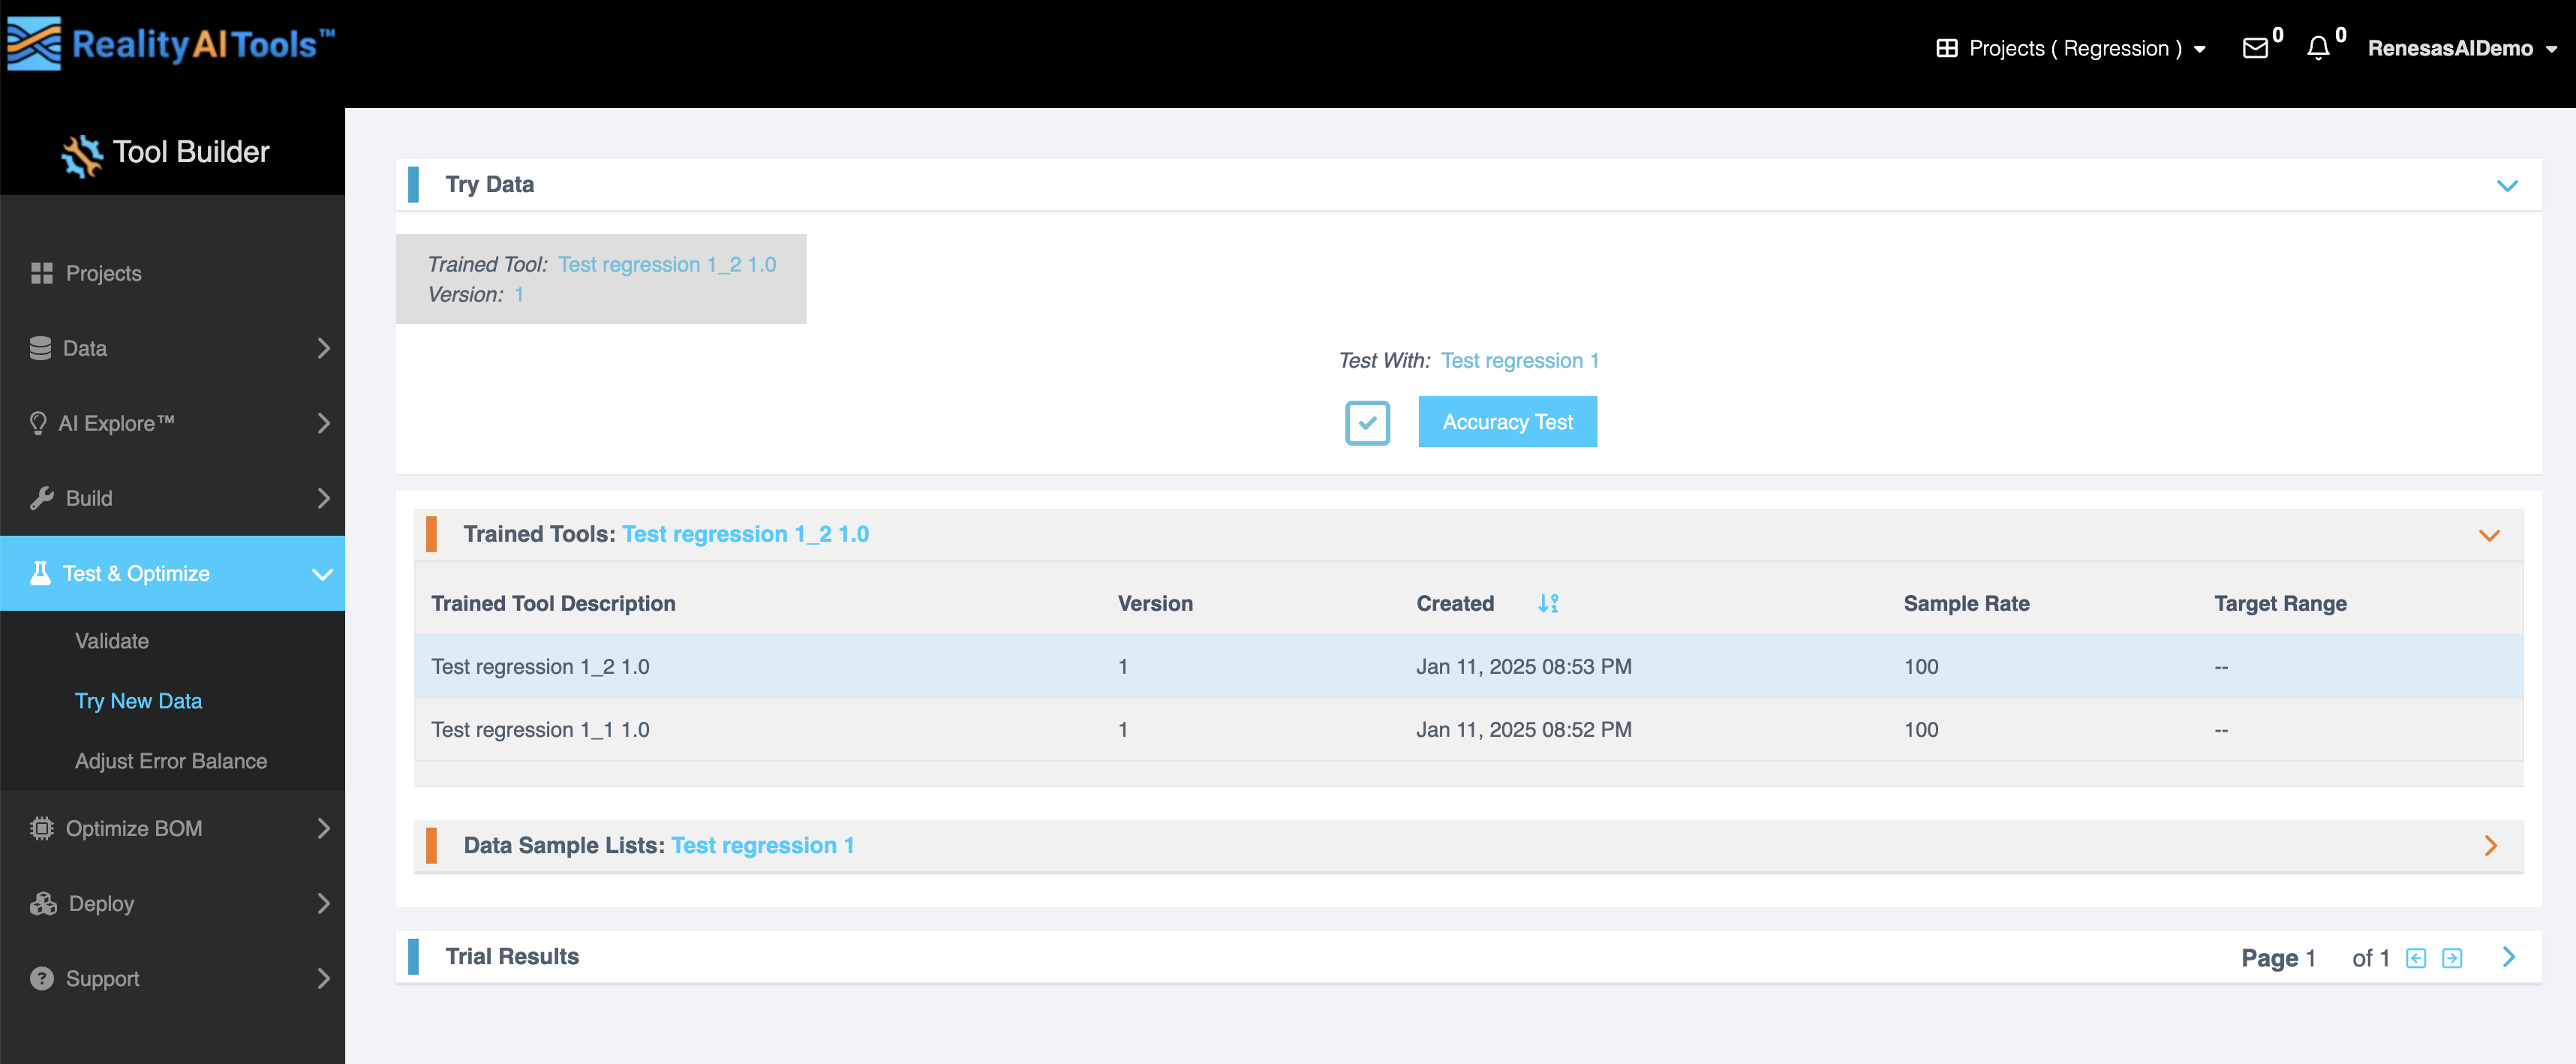
Using the menu on the left, go to Test & Optimize > Try New Data. This page is specifically designed to test your models.
-
Choose the Trained Tool (model) from the dropdown menu.
-
Select the Data Sample List you want to test against.
If testing against a blind dataset, ensure the data files are uploaded and segmented beforehand. -
Click the Accuracy Test button to start the test job.
NOTEThe duration of the test varies depending on the dataset size (e.g., a 1 GB dataset may take approximately 10 minutes).
-
After starting the test job, wait for 2–3 minutes and refresh the page.
-
Once completed, navigate to the Trial Results tab for detailed insights.
If you’re using streaming data, you can create a new test sample list from your original source file by going back to Data > Curate and re-segmenting the file using a smaller offset or even “All Shifts”. This will create a new, larger sample list, most of which will consist of samples that are slightly different from the ones on which the tool was trained. Run an accuracy test on this list and see if your results hold up.
Analyzing the Results
Key insights available in the trial results tab
| Field | Description |
|---|---|
| Confusion Matrix | Displays the matrix comparing the model's predictions with the ground truths (if labeled data is provided). |
| Statistics | Expands detailed metrics related to the model’s performance. |
| Sample-Level Details | Allows viewing of individual sample predictions, including errors and correct results. |
| Waveform Comparison | Enables visualization of the waveform for each data segment to compare successful and unsuccessful predictions. |
Exporting Results
To export the test results for further analysis:
- View Sample-Level Details
- Click on the Show Sample-Level Details button (located at the bottom left).
- Use the GUI to filter and view errors, correct predictions, or all results.
- Export to CSV
- Click on the Export to CSV button to download the results.
Fields in Exported Results:
- Results: Predictions made by the model.
- Expected Results: Labels provided during data upload (ground truths).
Working with Blind Datasets
For testing against blind datasets (data without labeled ground truths):
- Upload the data files and segment them appropriately.
- Initiate the test job as described earlier.
- Since no confusion matrix will be generated, you can still export the raw results in a CSV file for analysis.
Using Waveform Visualization
To compare the waveform plots of successful versus unsuccessful predictions:
- Go to the View Sample tab.
- Click on the waveform for a specific block of data.
- Analyze the visual differences to identify patterns or areas for improvement.
This visualization helps in understanding the relationship between data characteristics and prediction outcomes.