Anomalies
The Anomalies module is designed to identify unusual patterns or outliers in your data. This semi-supervised model requires only examples of Normal data to create a baseline, which serves as a reference for detecting anomalies. The module provides two key sections: Data Sample Lists and Anomaly Exploration Models for [List Name].
The primary goal of this module is to simplify anomaly detection by leveraging a baseline model of normal behavior, enabling efficient and accurate identification of deviations in your data.
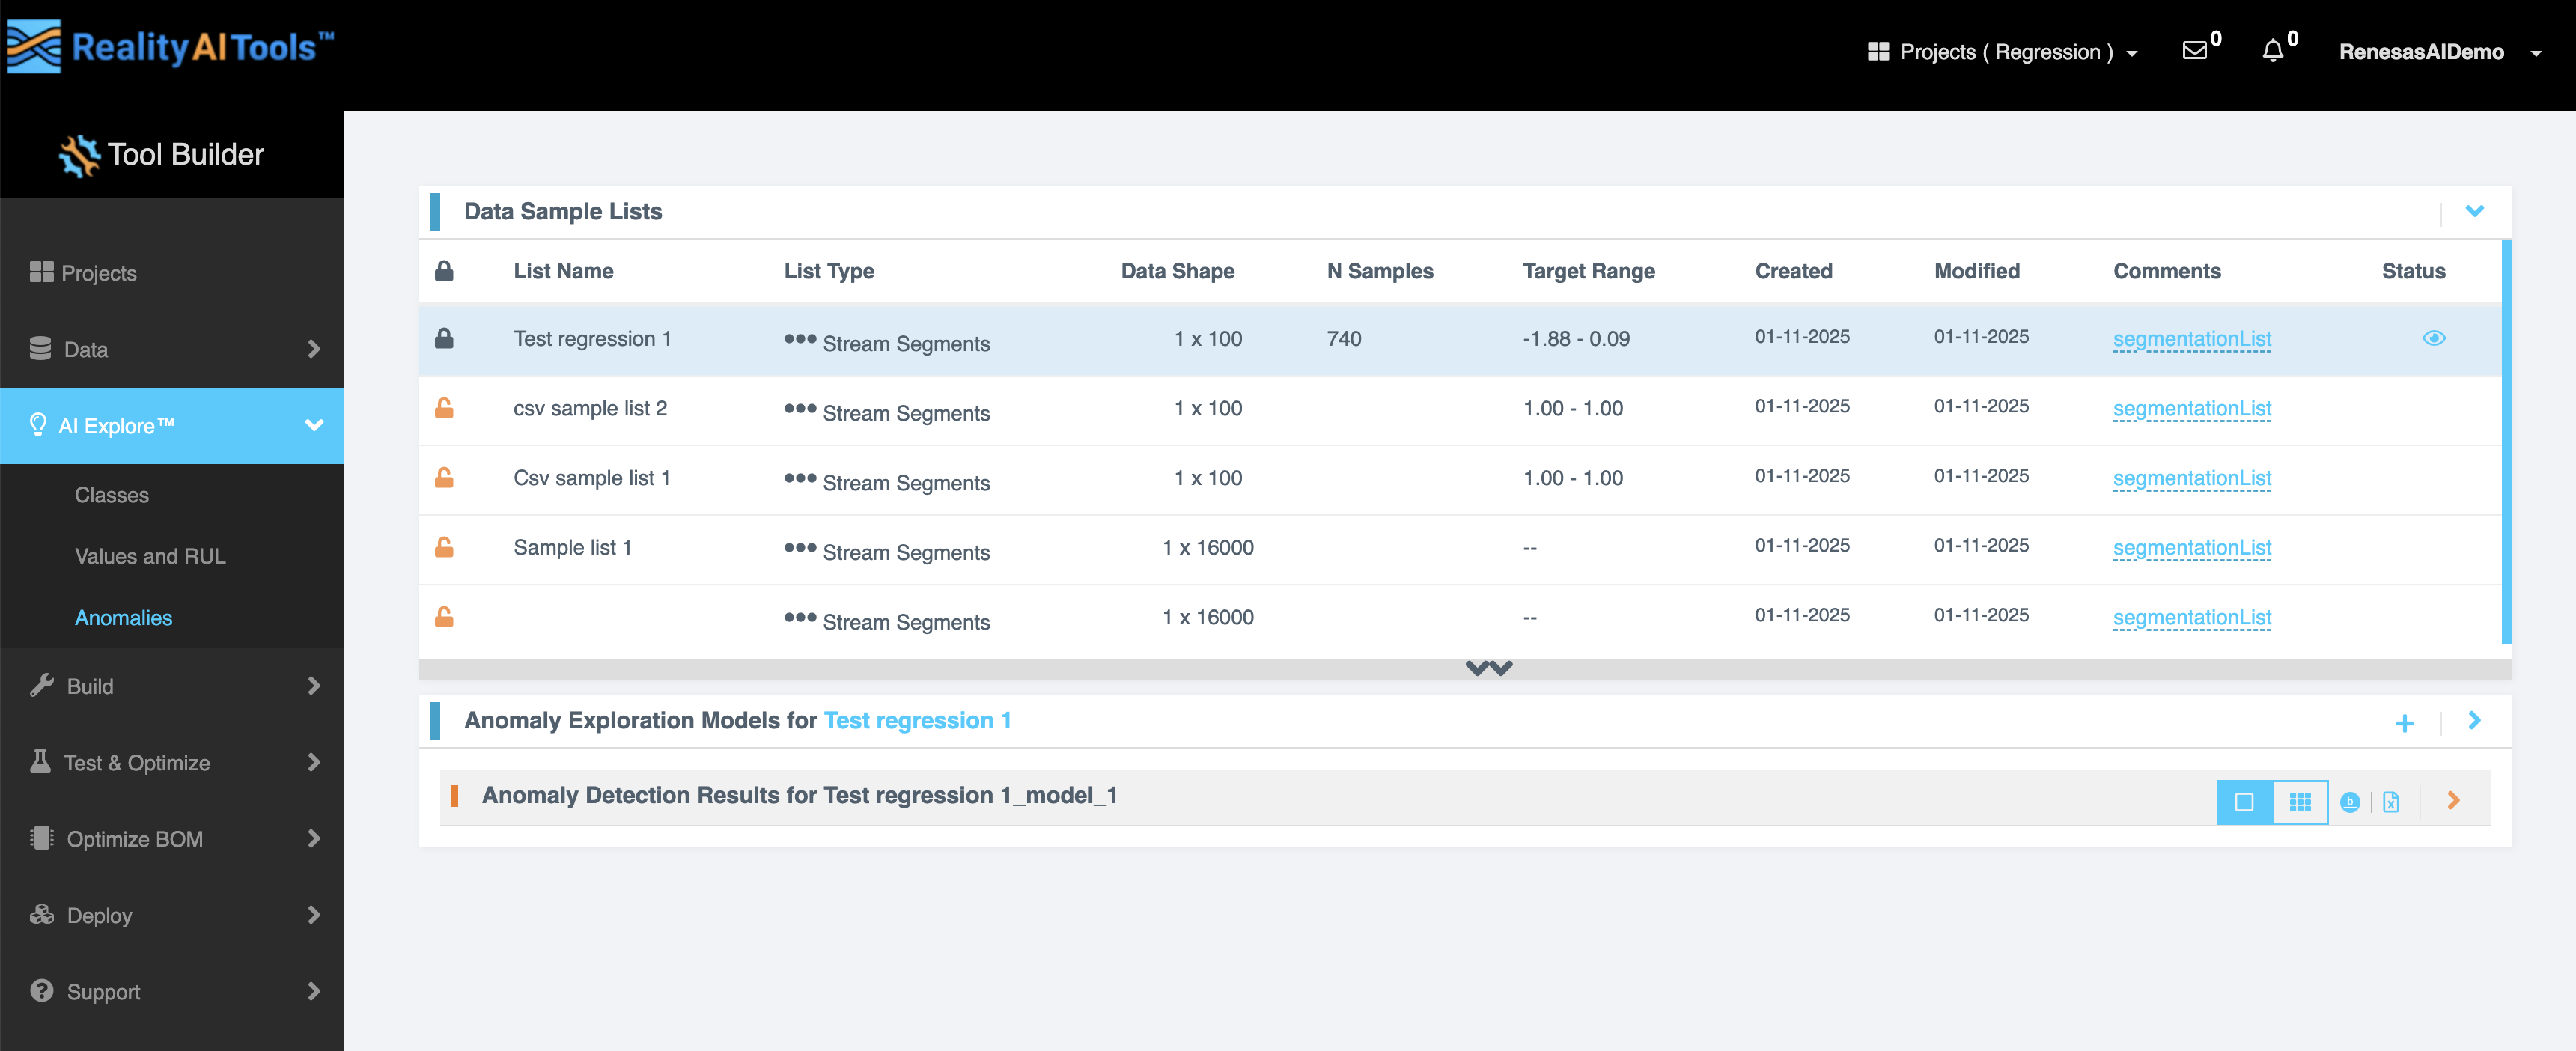
Data Sample Lists
This tab displays a table that organizes and manages your data samples.
| Field | Description |
|---|---|
| Lock Symbol | Indicates if the data sample is locked or unlocked. |
| List Name | Displays the name of the data sample list. |
| List Type | Specifies the type of list (e.g., Normal, Processed). |
| Data Shape | Shows the shape or dimensions of the data. |
| N Samples | The number of samples in the dataset. |
| Target Range | Indicates the range of target values. |
| Created | The date the list was created. |
| Modified | The date the list was last modified. |
| Comments | Any additional notes or comments about the data sample. |
| Status | The current state of the list (e.g., Active, Inactive). |
To proceed with anomaly detection, select a data sample list. This action opens the Anomaly Exploration Models for [List Name] tab.
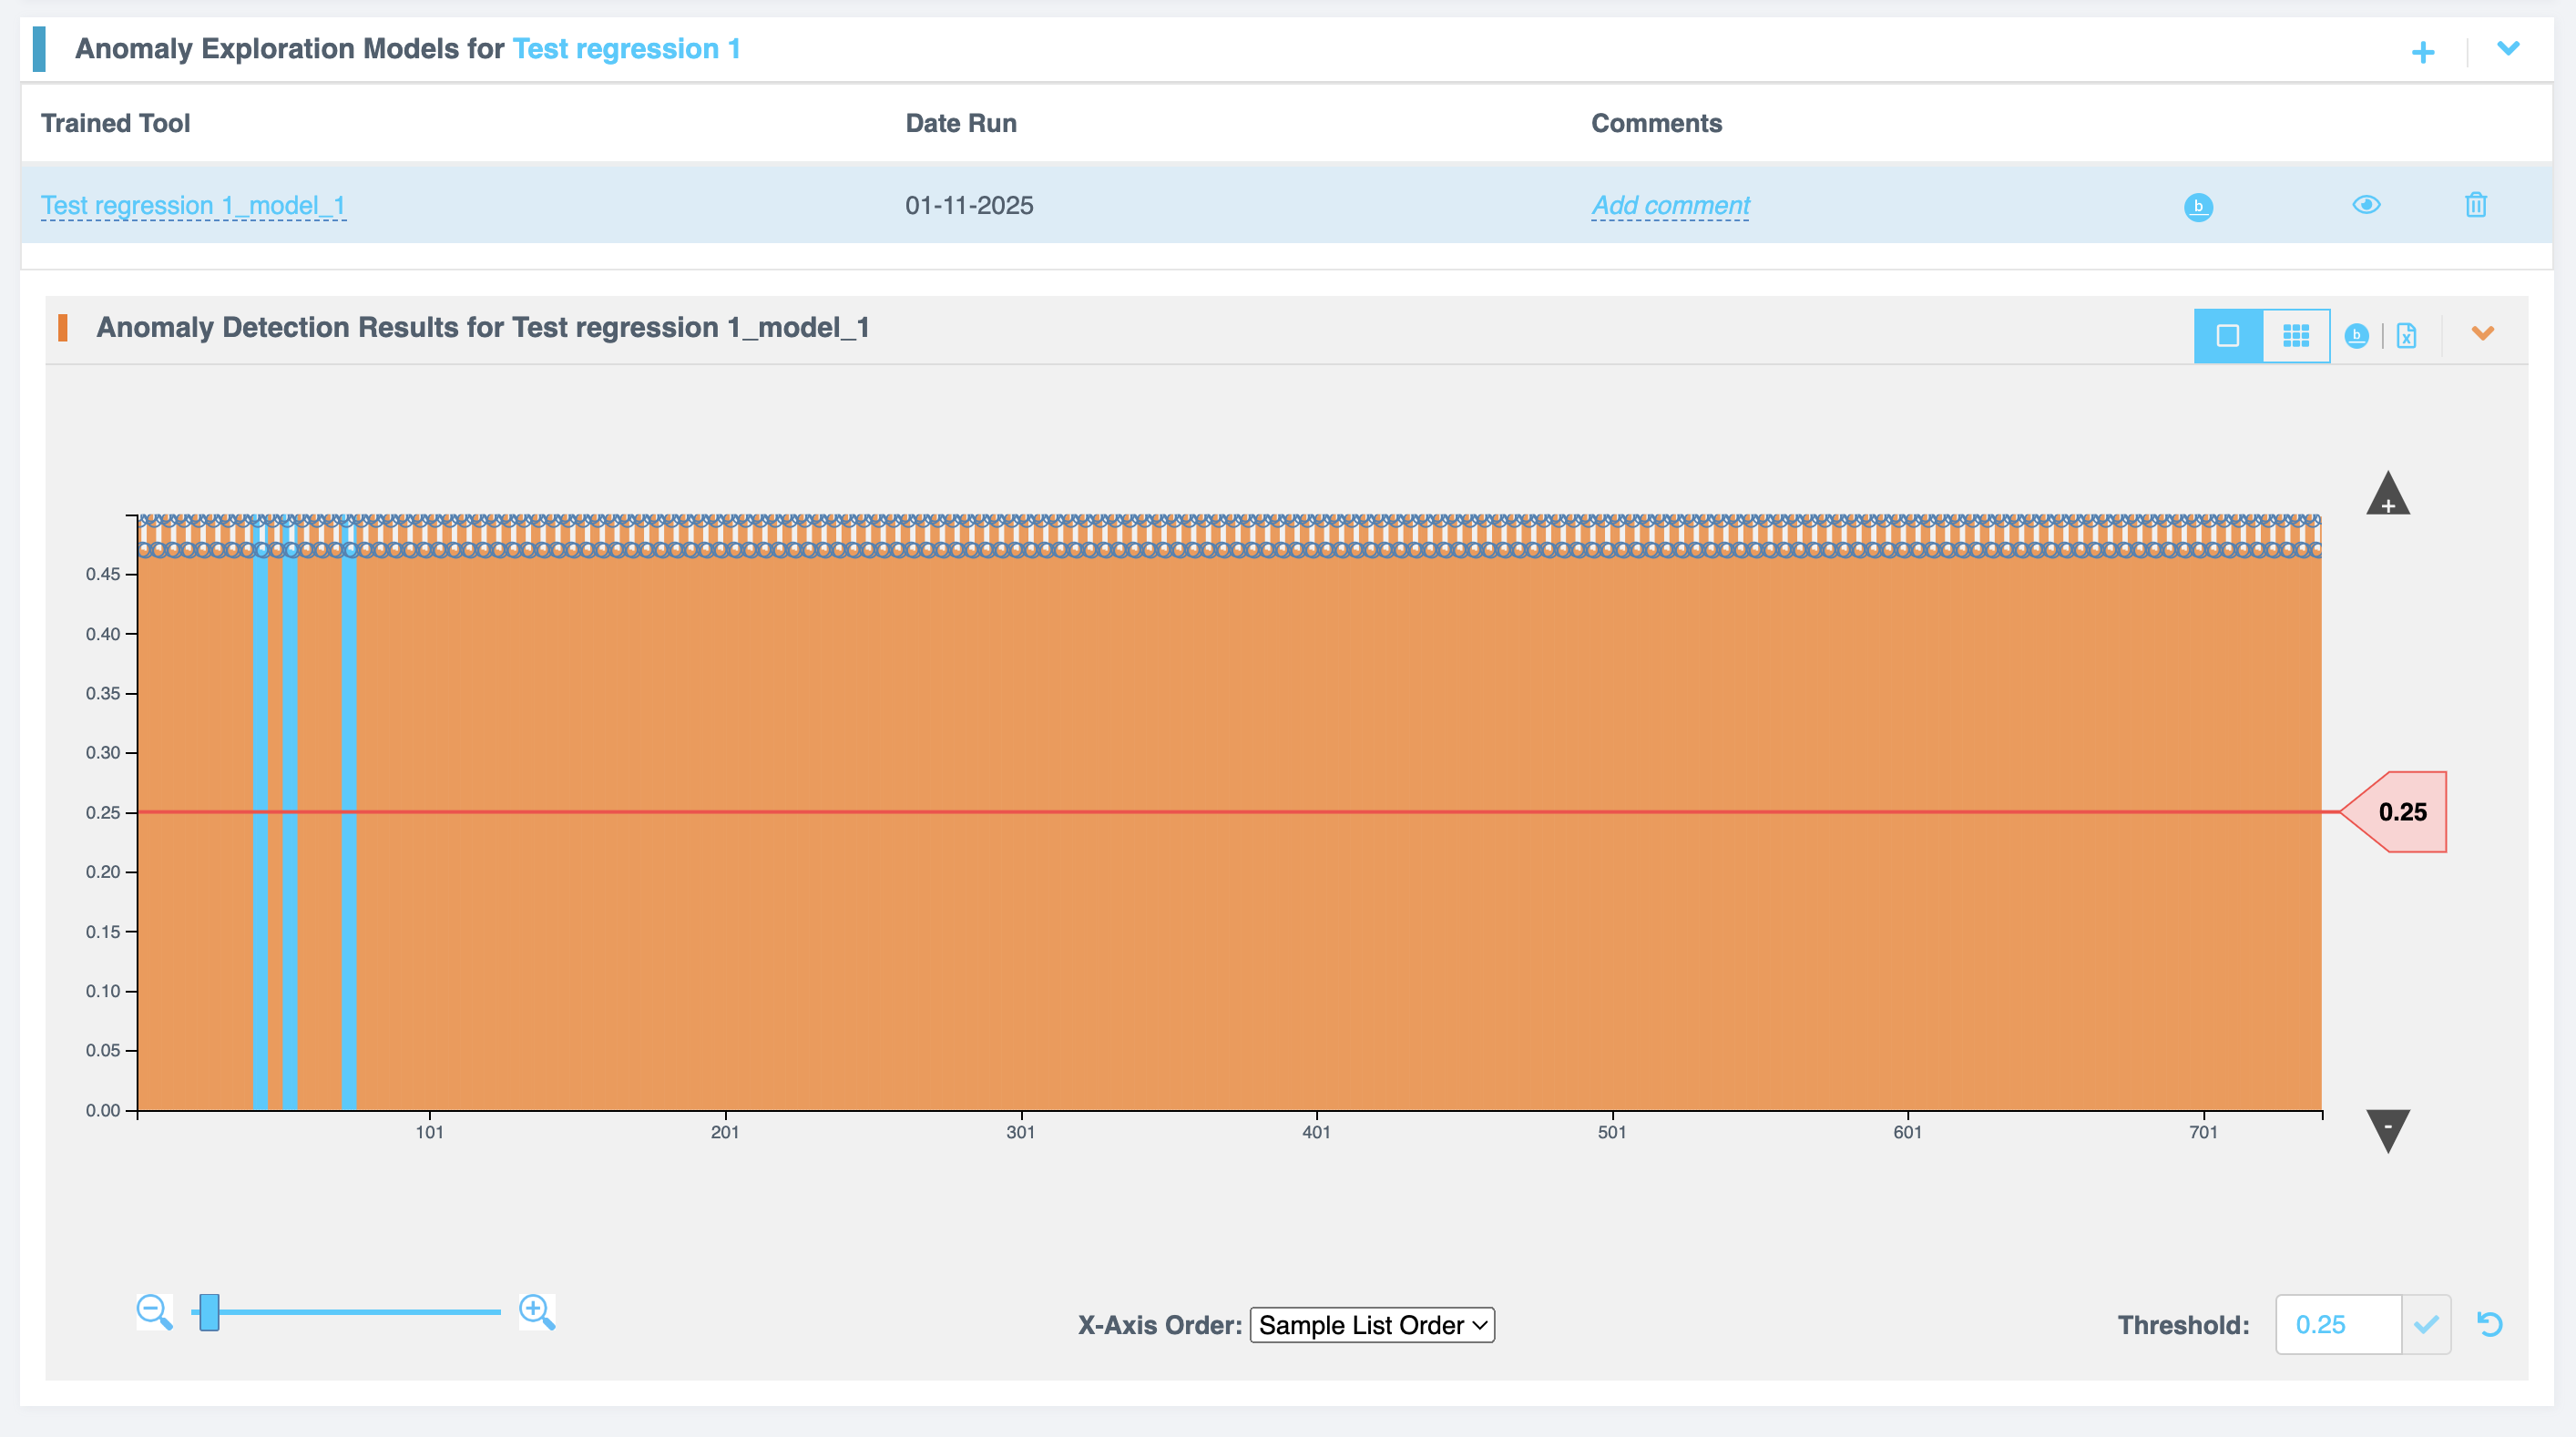
Anomaly Exploration Models for [List Name]
This tab focuses on models trained for anomaly detection based on the selected list.
| Field | Description |
|---|---|
| Trained Tool | The name of the tool used to train the model. |
| Date Run | The date the model was executed. |
| Comments | Notes related to the model or its training. |
| Baseline Definition | Opens a popup to define the baseline used for anomaly detection. |
| Explore (Eye icon) | Allows you to view the Anomaly Detection Results for the trained model. |
| Delete | Deletes the selected model from the system. |
Baseline Definition
Baseline definition enables you to optimize anomaly detection by focusing on specific feature spaces, saving time and computational resources. When you click the Baseline Definition icon, a popup opens with the following details:
- Trained Tool: Displays the name of the tool used for baseline training.
- Baseline Definition: Provides the parameters defining the normal behavior.
- Freqs: Lists the frequency ranges considered for anomaly detection.
- Data Type Explore Filter: Offers checkboxes to refine feature spaces explored:
- Raw Sensor Signals
- Processed Log Data
- Comments Box: Allows you to add specific notes for the baseline definition.
Anomaly Detection Results
These tools help users interpret anomaly detection results effectively and make data-driven decisions. Click the Explore (Eye Icon) to view the anomaly detection results for the selected trained tool. The results are presented in an interactive graph, providing detailed insights.
Graph Features:
- Top-right Options:
- View Graph: Displays the anomaly graph.
- View Thumbnails: Provides a thumbnail view for better data visualization.
- Show Baseline: Overlays the baseline on the graph for comparison.
- Export to CSV: Exports the results for further analysis.
- Bottom Options:
- Zoom Slider: Allows zooming in and out of the graph for a detailed view.
- X-Axis Order Dropdown: Enables reordering of the X-axis based on specific parameters.
- Editable Threshold Field: Lets you set or adjust the anomaly threshold dynamically.