Classes
The Classes section allows you to create and manage new classifiers through three tabs:
- Data Sample List
- Distributions for List
- Exploration Results for List
Data Sample List Tab
This tab provides a detailed table displaying the properties of the data sample list.
| Column | Description |
|---|---|
| Lock Status | Indicates whether the list is locked for editing. |
| List Name | Name of the data sample list. |
| List Type | Type of the list (e.g., regression, classification). |
| Data Shape | Shape of the data (e.g., rows, columns). |
| N Samples | Number of samples in the list. |
| Target Range | Range of target values. |
| Created | Date & time when the list was created. |
| Modified | Date & time when the list was last modified. |
| Comments | Any additional notes or observations. |
| Status | Current status of the list (e.g., active, archived). |
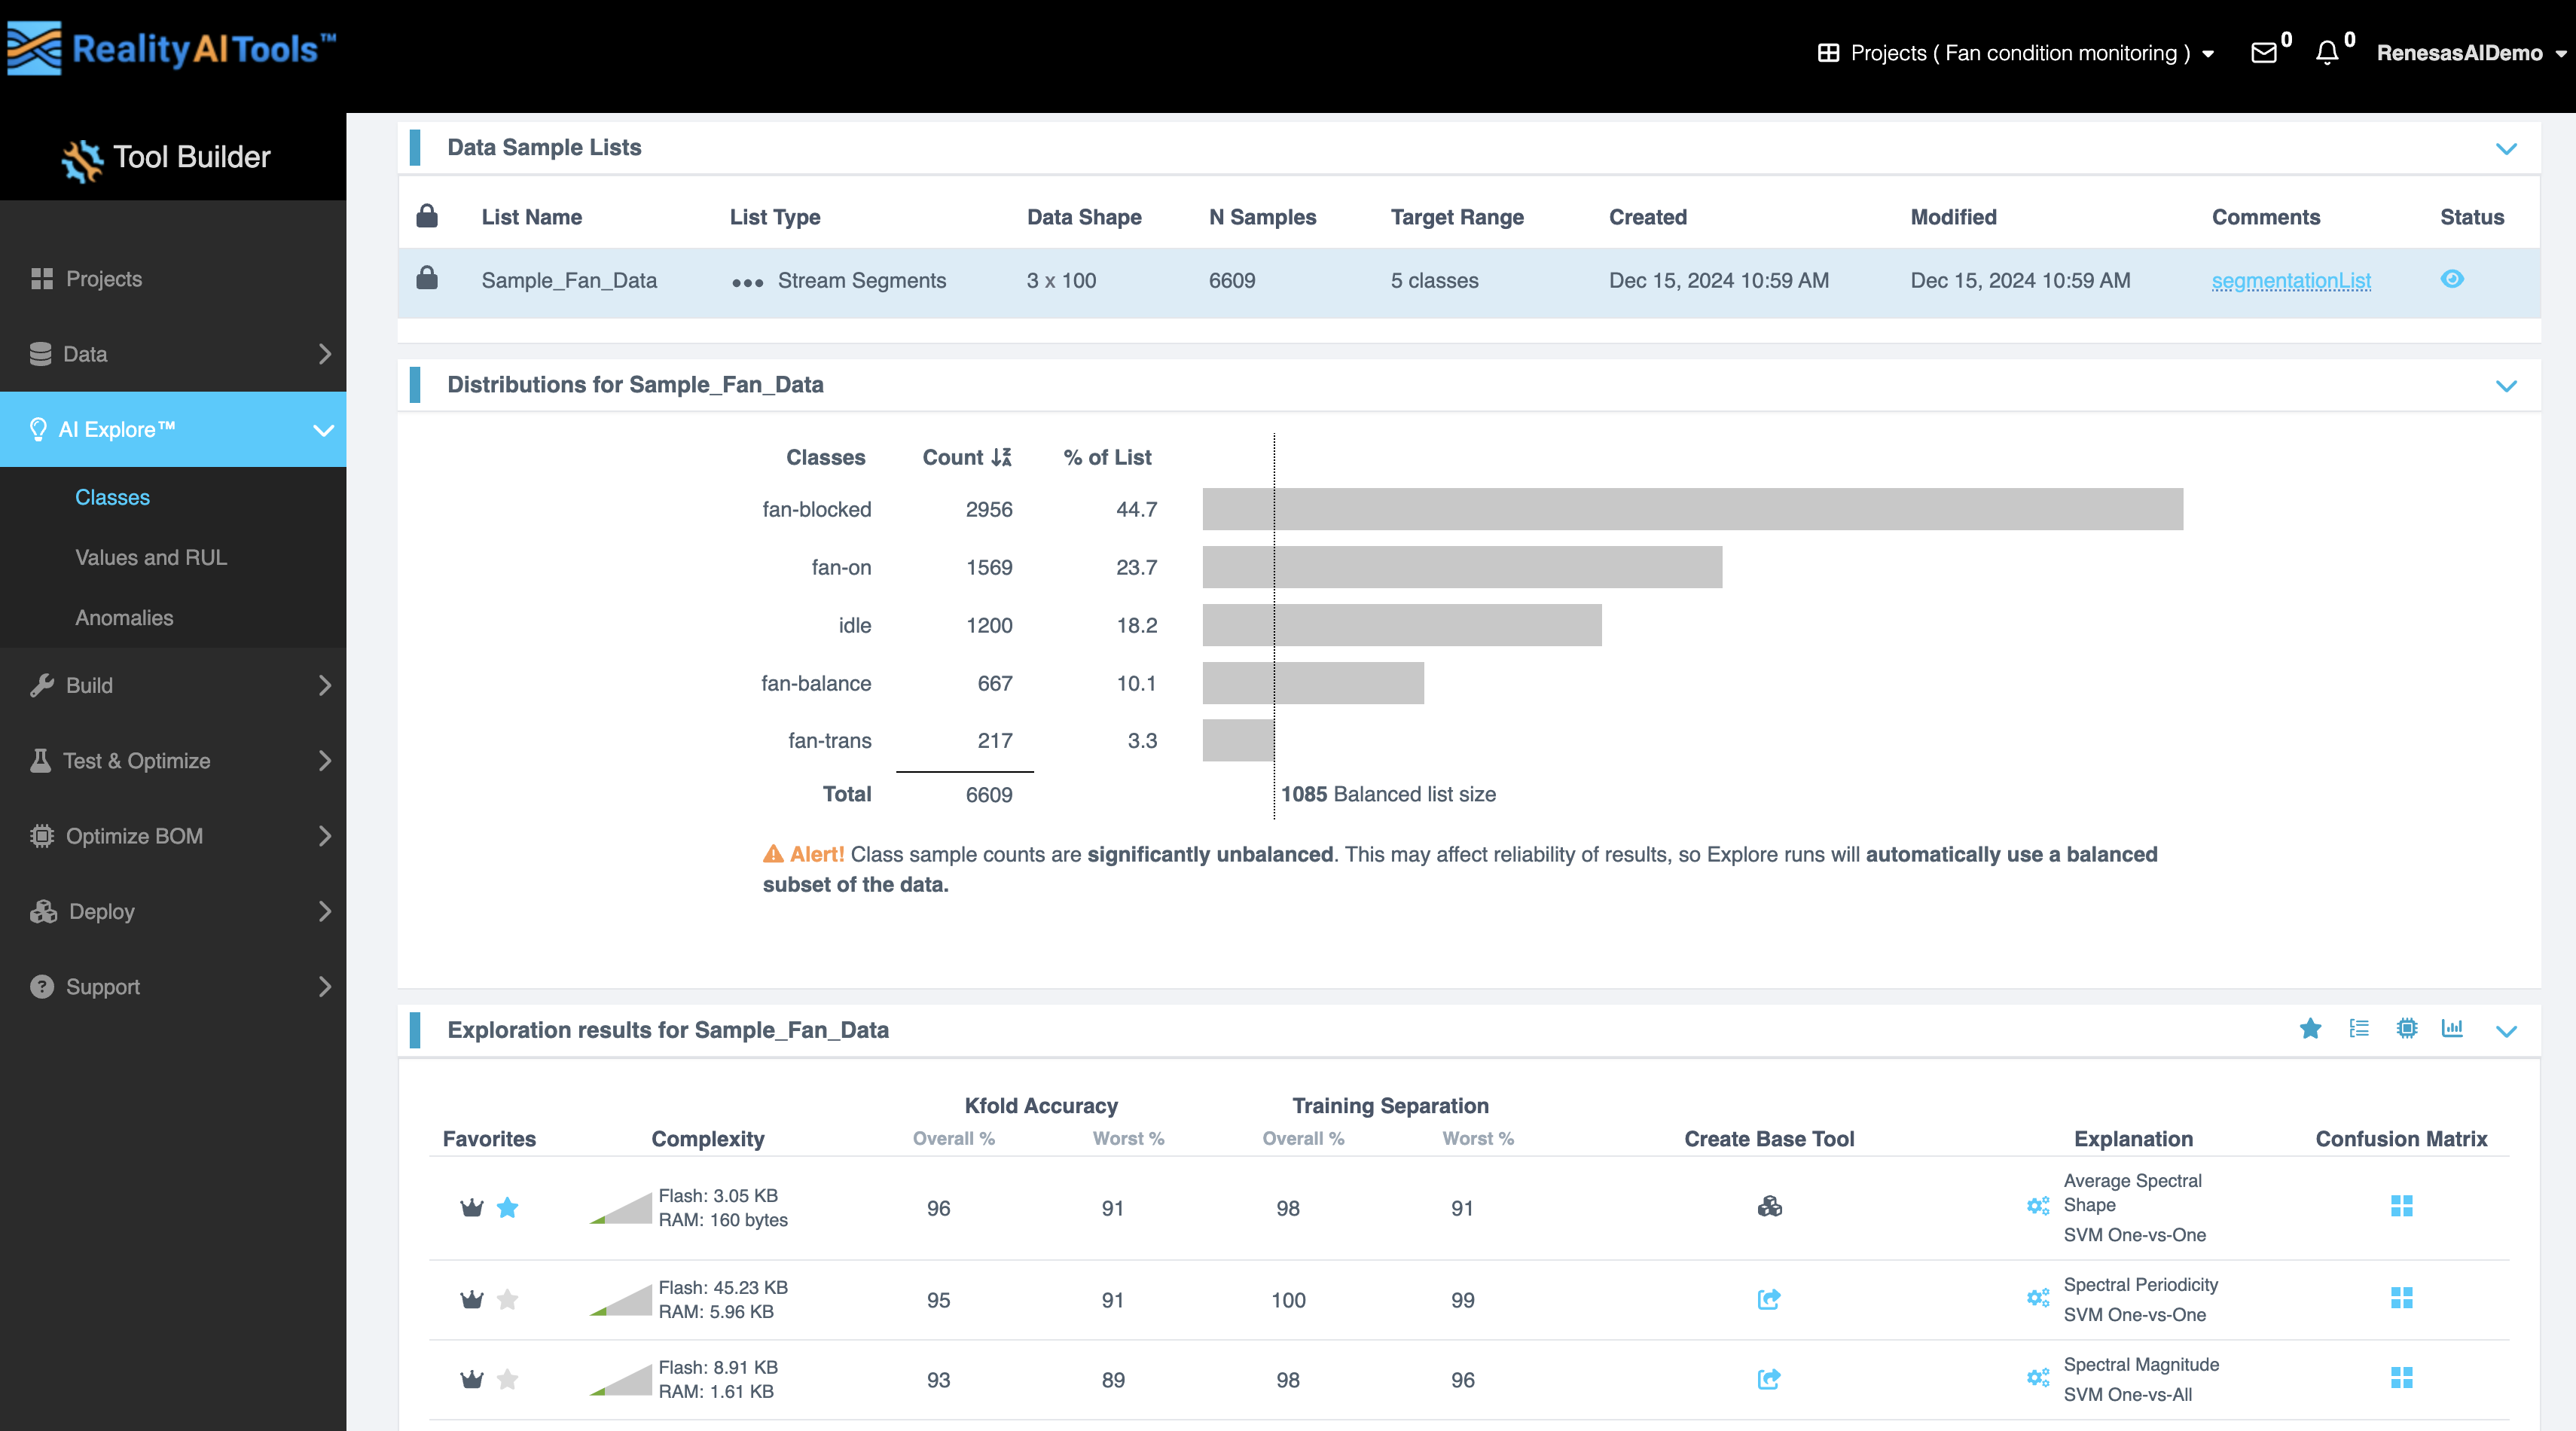
Distributions for List Tab
This tab shows the distribution of classes in the selected list.
- Columns in the Table:
- Classes: Names of the classes in the data.
- Count: Number of samples in each class.
- % of List: Proportion of each class in the entire list.
- Features:
- A graphical representation of the distribution is displayed alongside the data.
- Total count and balanced list size are also shown.
- Alerts: If class sample counts are significantly unbalanced, an alert will be displayed:
“Class sample counts are significantly unbalanced. This may affect the reliability of results, so Explore runs will automatically use a balanced subset of the data.”
Exploration Results for List Tab
Click Start Exploring button.
Exploration Results Interface
When running an exploration, you can monitor and interact with the results using the provided tools and options. In the Exploration results section, each row represents a different model based on different features identified during the AI Explore run. This section outlines each feature, its purpose, and instructions for usage.
What Happens in the Background
When you click the Run Explore button, the Reality AI algorithm begins analyzing your data. The algorithm generates multiple optimized feature sets and machine learning models tailored to your classification problem. It then displays only the top-performing results.
How the Algorithm Works
- Balanced Subset Creation
The algorithm creates a balanced subset of the sample list, ensuring that each class has an equal number of samples. If the sample list is very large, it may also sub-sample the data to reduce processing time. - Feature and Model Optimization
The algorithm identifies the most effective feature sets and machine learning parameters for distinguishing between the training classes in your data. It evaluates hundreds of potential feature sets and models during this process. - Model Training and Validation
Promising feature sets are used to construct machine learning models, which are trained on the balanced sub-sample. These models undergo a K-Fold Cross-Validation process to assess their performance. - Result Selection
Only the best-performing models and feature sets are displayed, providing you with the most effective solutions.
What is K-Fold Validation?
K-Fold validation is a method for evaluating model performance by dividing the dataset into K equal parts (folds). Each fold is used as a testing set once, while the remaining folds are used for training.
For example, in 10-Fold Cross-Validation (K=10):
- The dataset is split into 10 folds.
- In the first iteration, fold 1 is used for testing, and the remaining 9 folds are used for training.
- In the second iteration, fold 2 is used for testing, and the rest are used for training.
- This process continues until each of the 10 folds has been used as the testing set once.
Reality AI Tools uses K=10 for cross-validation on the AI Explore page to ensure robust and reliable model evaluation.
Key Actions During Exploration
| Action | Description | Purpose and Effect |
|---|---|---|
| Stop Explore | Click this button to terminate the exploration process. | Halts the exploration, useful if adjustments are needed or the test is taking too long. |
| Run Explore | Once clicked, the Start Explore button disappears, and the exploration begins. | Initiates the exploration process. |
| Star Icon | Replaces the + icon after running the exploration. | Click to view starred results. |
| Group by Icon | Opens a dropdown with Feature Space and Decision Structure options. | Feature Space: Groups results by detailed features like Spectrograms, Spectral Features, Statistical Data, Sample Data, and Phase Features. Decision Structure: Groups results by classifier type (SVM, NN, CNN). This enables grouping by feature attributes or classifier methodologies, simplifying data analysis based on user preferences. |
| Microcontroller Icon | Opens the Filter Exploration Results popup. | Allows you to select a target device and specify parameters like Flash and RAM size. |
| Graph Icon | Click to toggle between graphical and tabular views of the data. | Displays data as a graph adjusted for complexity. Clicking again switches to a table view. |
Filtering Exploration Results
- Click the Microcontroller Icon to open the Filter Exploration Results popup.
- Select the target device from the dropdown menu.
- The Flash and RAM sizes populate automatically but can be manually edited.
- Use the following options:
- Clear: Resets the filter selections.
- Apply: Applies the selected filter to the results.
Viewing Data
The exploration data is initially displayed graphically, with options to adjust the view.
| Icon | Action | Effect |
|---|---|---|
| Show More Results | Click at the bottom of the results table to expand the list beyond the top three results. | Reveals additional exploration results. |
| Show Fewer Results | Click to collapse the expanded results back to the top three. | Simplifies the view to focus on key results. |
Data Table Fields
Column | Description |
|---|---|
Favorites | Click the star icon to mark a result as a favorite. |
Complexity (Flash/RAM) | This field displays the Flash and RAM requirements for each result, allowing you to evaluate the resource demands of various configurations.
This information helps assess the model's suitability for resource-constrained environments. |
Overall% and Worst% | Shows the accuracy percentages for k-fold cross-validation and training separation. |
Create Base Tool | Allows you to create a Base Tool for further processing. A Base Tool is a program capable of learning from the data contained in a specific sample list. A Base Tool combines: Data structure definition, Parsing/segmenting method, Feature selection, Machine learning model, and Output class definition. |
Explanation | This field provides insights into the decision structure, decision significance, and class significance through interactive plots.
These visualizations help interpret the model's behavior and the importance of different features in its predictions. |
Confusion Matrix | Opens a detailed view of k-fold and training separation results across actual and output classes providing detailed accuracy and F1 score statistics. |
Detailed Description of the Features
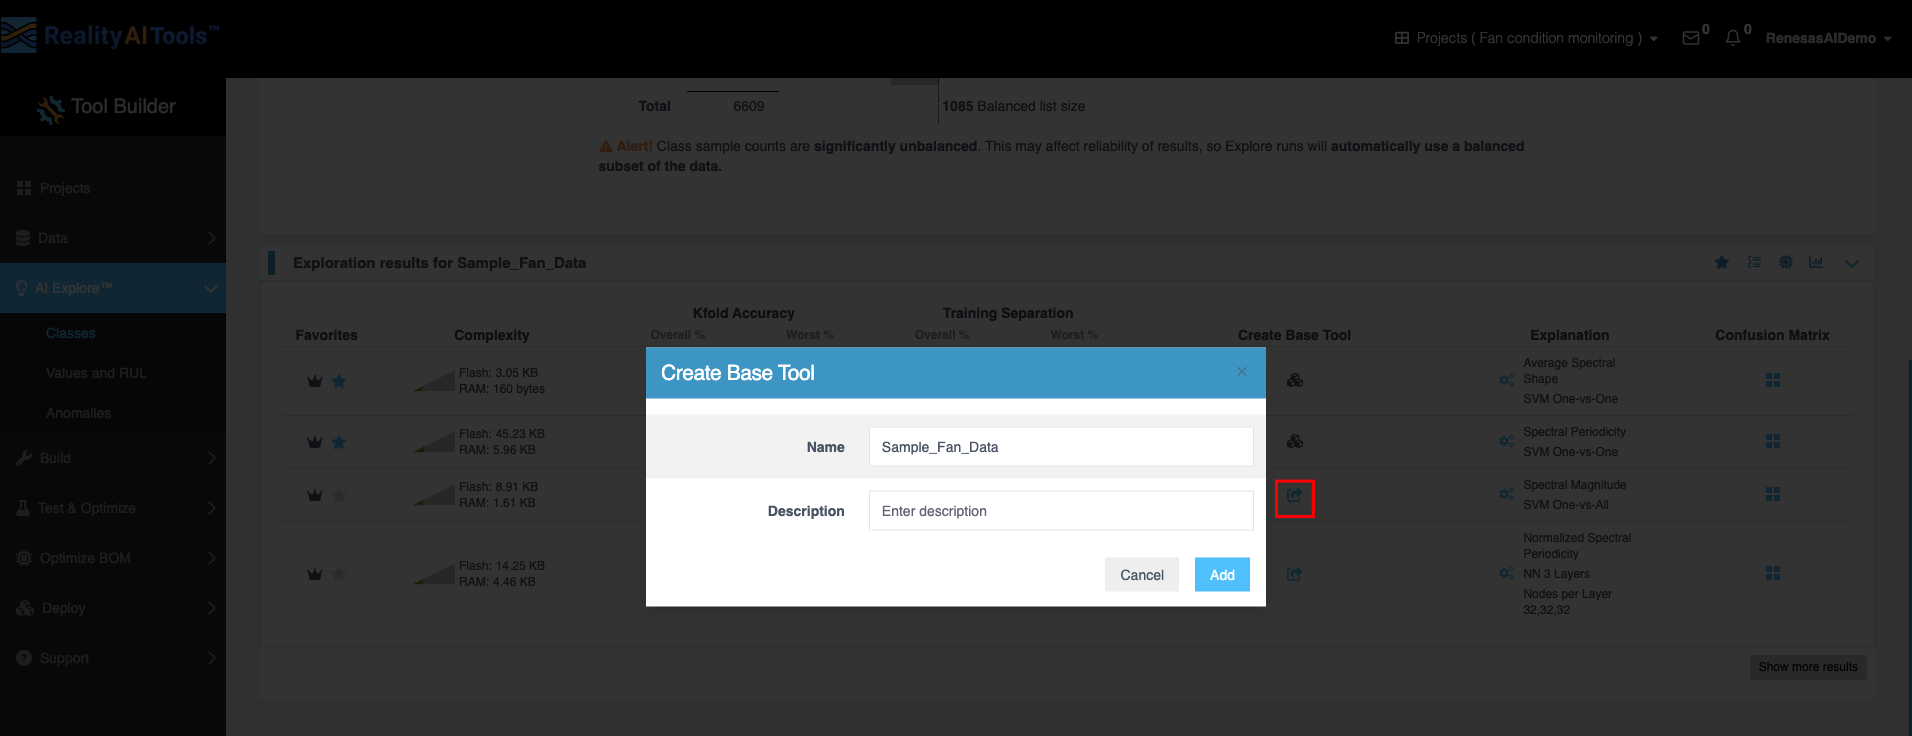
- Create Base Tool:
- Click the icon in the Create Base Tool column to open the window.
- Enter the tool's name and description.
- Click Add to save the tool.
- Once this is done, the icon changes.
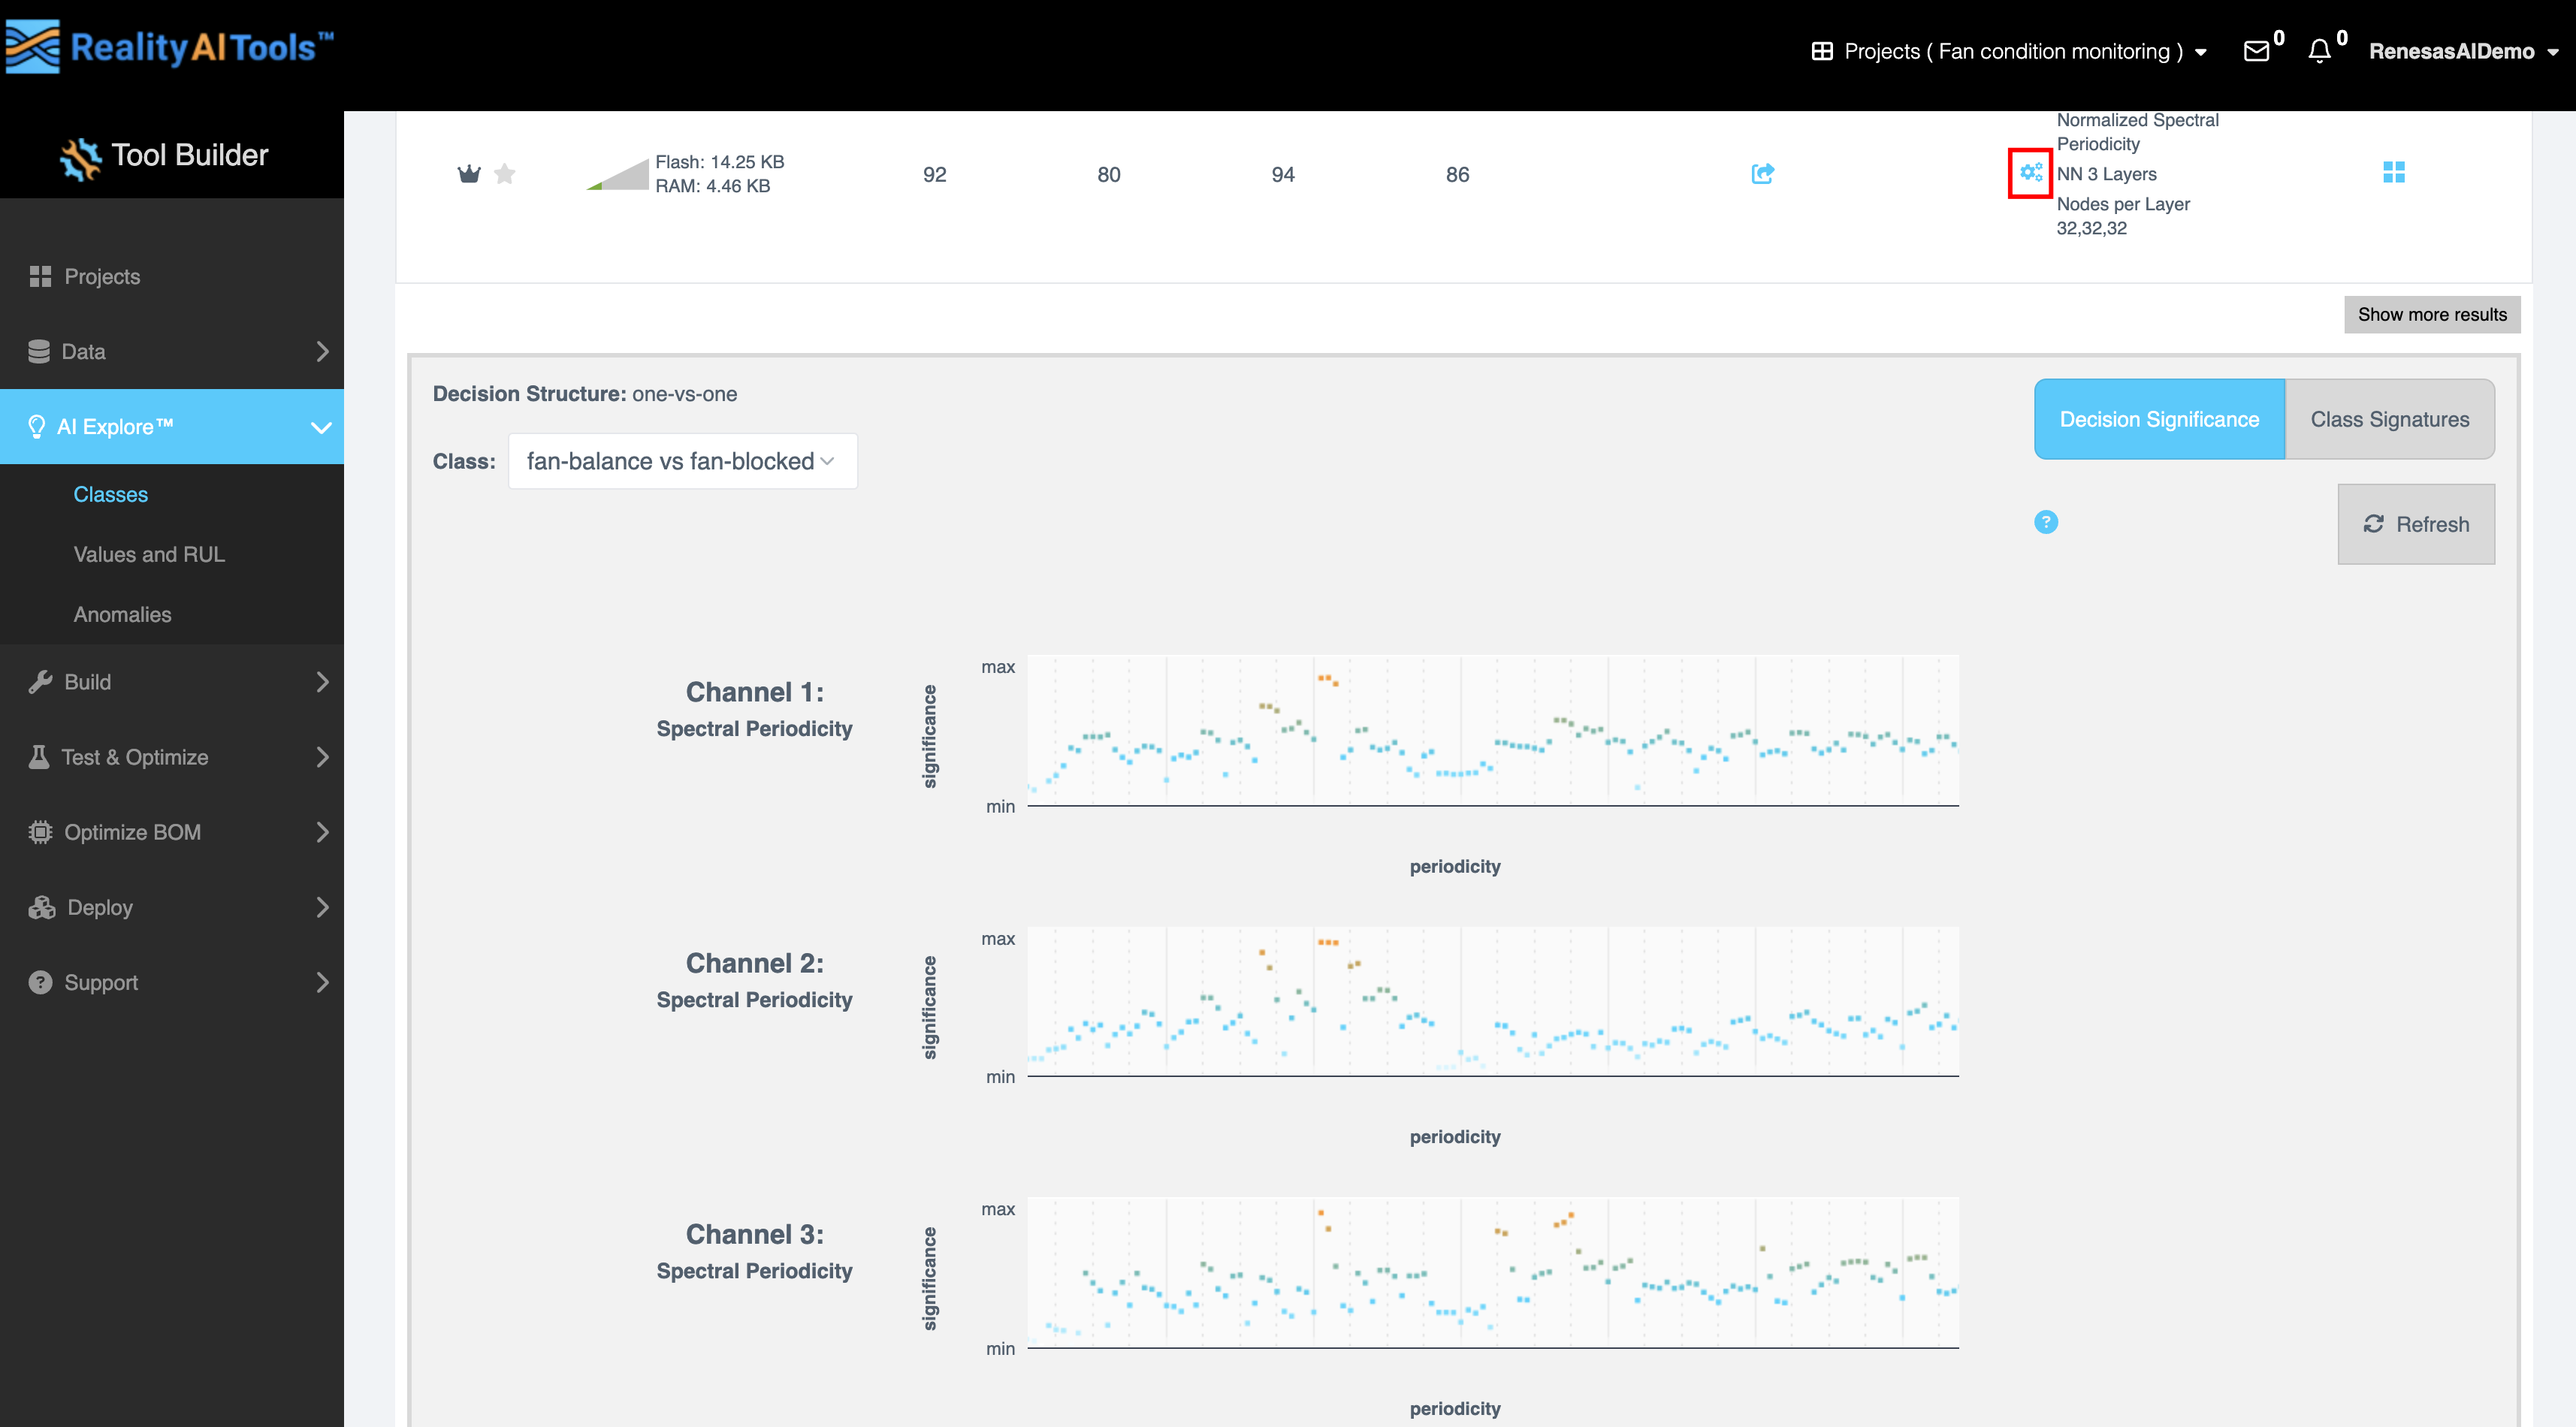
- Explanation:
- Select the gear icon to view:
- Decision Structure: Visual representation of decision-making paths (one-vs-one). One-vs-one refers to a classification strategy used in machine learning models, particularly for multi-class classification tasks.
- Class: Select the required classes for which you want to generate the graph.
- Decision Significance: Displays the impact of features using orange (high significance) and blue (low significance) blocks. Features with higher orange blocks are more significant for decision-making, indicating their strong contribution to classifier performance.
- Class Significance: Choose a class from the dropdown to analyze its influence on the results.
- Select the gear icon to view:
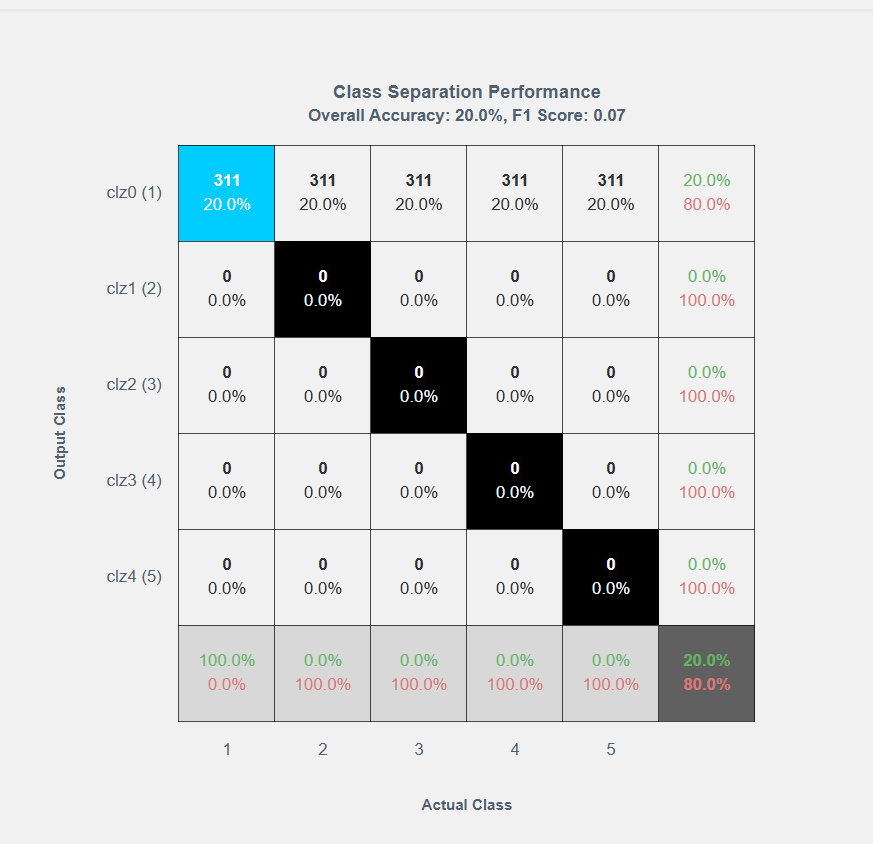
- Confusion Matrix:
- Click the icon in the Confusion Matrix column to open the matrix.
- Review k-fold and training separation data across actual and output classes.
- Select one of three matrix variations.
- First option shows a blank confusion matrix with overall accuracy and F1 score.
- Second option shows accuracy for each class/category.
- Third option shows errors percentage, confusions and detailed precision and recall numbers.
- Click the Clipboard Icon to copy the matrix data for external use.