Values and RUL
The Values and RUL section enables you to process regression data effectively. RUL stands for Remaining Useful Life, a critical metric in predictive modeling for estimating how long a system or component will function before requiring maintenance or replacement. This section is divided into three segments:
- Data Sample List
- Distributions for [List Name]
- Exploration Results for [List Name]
Each segment provides unique functionalities and insights to help you analyze and refine regression data for model development.
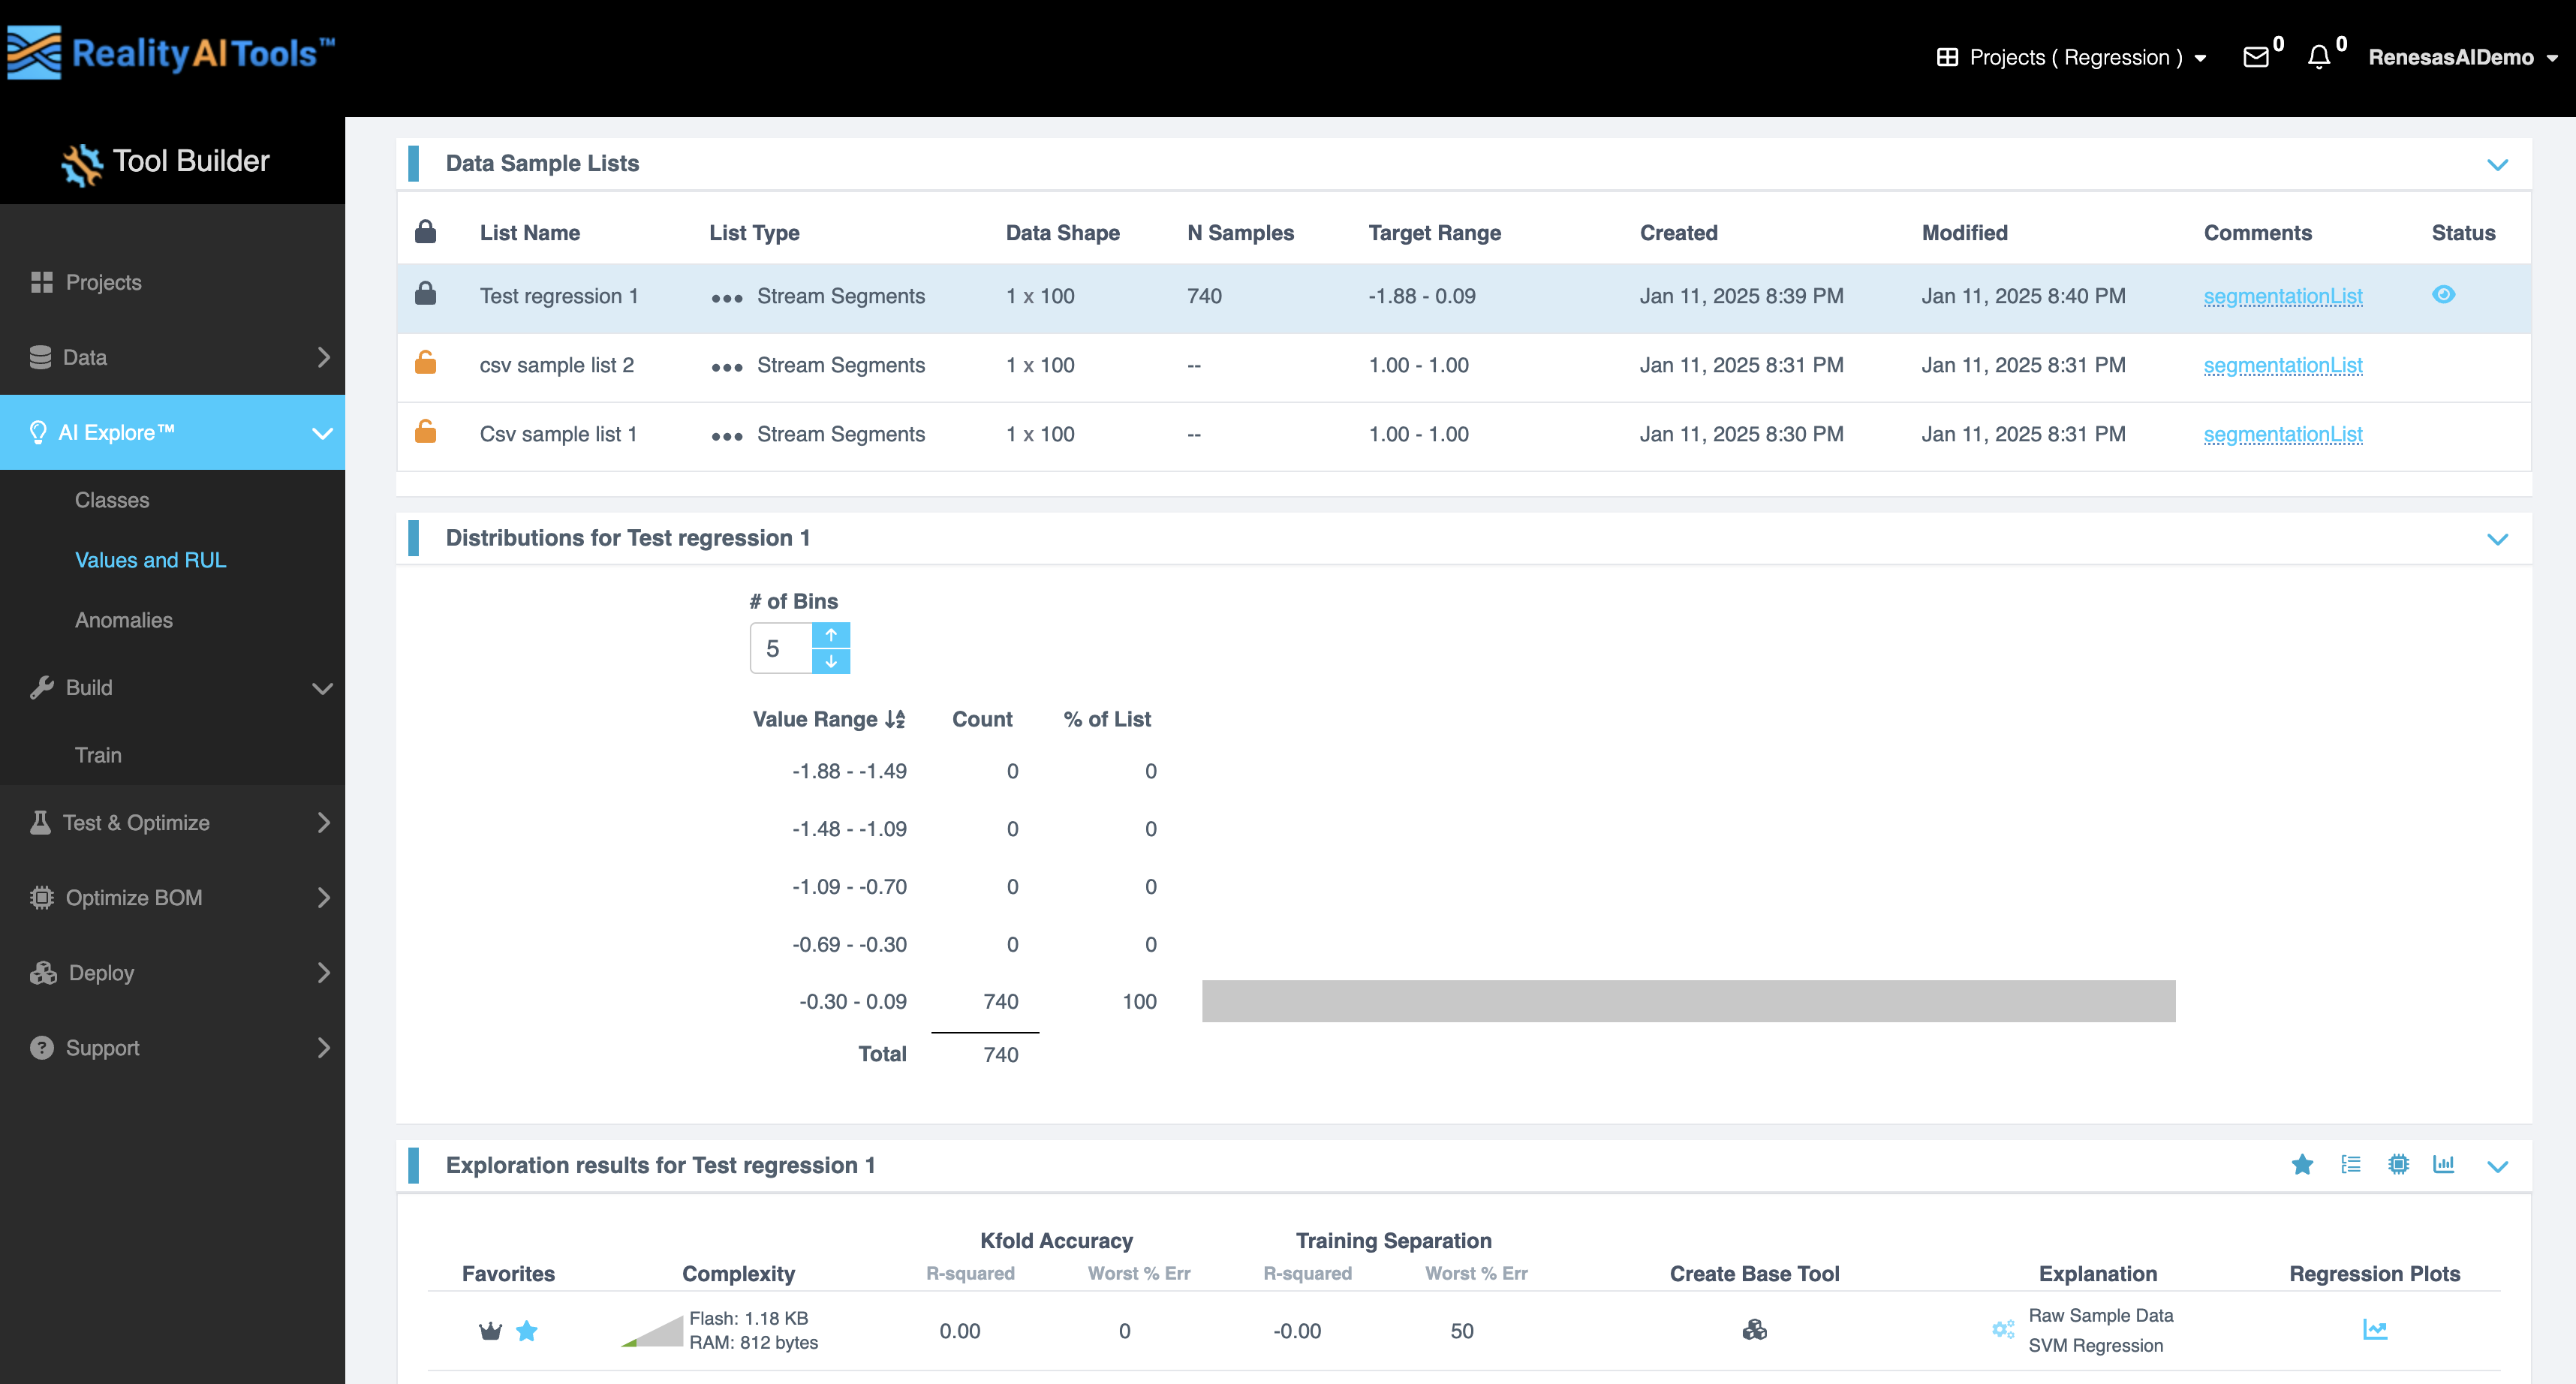
Data Sample List
The Data Sample List segment displays an interactive table with the following fields:
| Field | Description |
|---|---|
| Lock Symbol | Allows you to lock or unlock specific data samples to prevent accidental edits. |
| List Name | Displays the name of the current data sample list. |
| List Type | Specifies whether the list is for training, validation, or testing purposes. |
| Data Shape | Indicates the dimensions of the data in terms of features and samples. |
| N Samples | Shows the number of samples in the data list. |
| Target Range | Displays the range of target values in the data. |
| Created | Shows the date and time when the data list was created. |
| Modified | Displays the date and time of the last modification made to the data list. |
| Comments | Includes any notes or remarks associated with the data list. |
| Status | Indicates the current state of the data list, such as ready, in progress, or locked. |
This table helps you organize, review, and manage your regression data efficiently.
Distributions
The Distributions segment visualizes the distribution of your data samples, offering critical insights into the dataset's characteristics. It includes:
| Field | Description |
|---|---|
| # of Bins | Specifies the number of bins for the histogram. You can manually enter a value or adjust it using the up and down arrows. |
| Value Range | Displays the range of values in the selected bin. |
| Count | Indicates the number of samples within each bin. |
| % of List | Shows the percentage of total samples that fall within each bin. |
| Total Count | Displays the total number of samples in the data list. |
This segment allows you to analyze data distribution patterns and identify anomalies or imbalances.
Exploration Results
The Exploration Results segment provides detailed metrics and visualizations to evaluate your regression data. Key features include:
| Field | Description |
|---|---|
| Favorites | Allows you to mark preferred configurations or results for quick access. |
| Complexity | Displays the computational complexity, including resource requirements like Flash and RAM for different configurations. |
| Kfold Accuracy | Shows cross-validation accuracy metrics, including R-squared and Worst% Error values. |
| Training Separation | Provides performance metrics for training data, including R-squared and Worst% Error values. |
| Create Base Tool | Enables you to create a baseline tool or model configuration for further analysis. |
| Explanation | Offers insights into the decision structure and significance of various parameters, along with interactive plots for deeper analysis. |
| Regression Plots | Displays visualizations like scatter plots or line graphs to represent regression outputs and their alignment with target values. |
This segment is essential for refining models and understanding their performance before deployment.
Creating AI Models and Viewing Statistics
This procedure guides you through creating AI models using an uploaded dataset and reviewing various statistics for these models.
- On the left menu, go to AI Explore > Values and RUL.
- On the Data Sample Lists segment, choose the required segmented list from the table.
- In the Exploration Results tab, click Start Exploring.
- The system begins processing the feature spaces and generating models.
- You can monitor the progress and view the top-performing models listed on the page.
- For more information about this stage, refer to the Exploration Results Interface section.
- Each row in the Exploration Results section represents a model based on features identified during the AI exploration process. To view detailed accuracy statistics, click the Regression Plots row for the desired model.
- A blank Regression Plot opens. At the bottom of the screen:
- Click the first option to view the confusion matrix, which includes overall accuracy, F1 score and error distribution.
- Use the error distribution plot to identify the concentration of errors across the numeric range. A wider distribution indicates poorer model performance.
- Click the second option to access two plots:
- Regression Plot: Shows actual vs. predicted values for the selected model.
- Residual Error Plot: Displays sample-wise residual errors.
- Click the first option to view the confusion matrix, which includes overall accuracy, F1 score and error distribution.
The key metrics include**
- Residual Error: The vertical difference between a data point and the regression line, representing the error between predicted and observed values.
- R-squared (R²): A measure of how well the independent variable explains the variation in the dependent variable. Higher values indicate better fit.
- Mean Absolute Error (MAE): The average of all absolute errors, representing the average error magnitude.
- Hover over the Complexity tab to view resource consumption for the model:
- Feature Space: Multiplication operations for feature calculation.
- Classifier: Multiplication operations required for the classifier (blank for regression models).
- Total: Overall multiplication operations.
- Use the complexity numbers to gauge resource requirements for the model on target processors (MCU/MPUs). For example:
- If spectral-based features are important, and the decision significance plot highlights frequencies under 50 Hz, applying a filter for frequencies < 50 Hz during feature computation can reduce resource consumption.
- If you preselected a target processor during project creation, the top-performing models will align with the available resources for that processor.
- After reviewing the statistics, click the highlighted option to deploy the model for further testing or export.