Readiness
After uploading and formatting your data, you can view its statistics under the Readiness tab. This tab provides an overview of Files, File Size, Data Shape, Time Duration, and Last Updated Date and Time.
You’ll also find an option to Rescan All Files for updated insights.
The Readiness section includes four tabs:
- File Consistency
- Data Quality
- Category Coverage
- Time Coverage
Use the Filter icon on the left side to filter the data by the selected properties such as Data Shape, Data Type, Sample Rate, File Size and Data Columns.
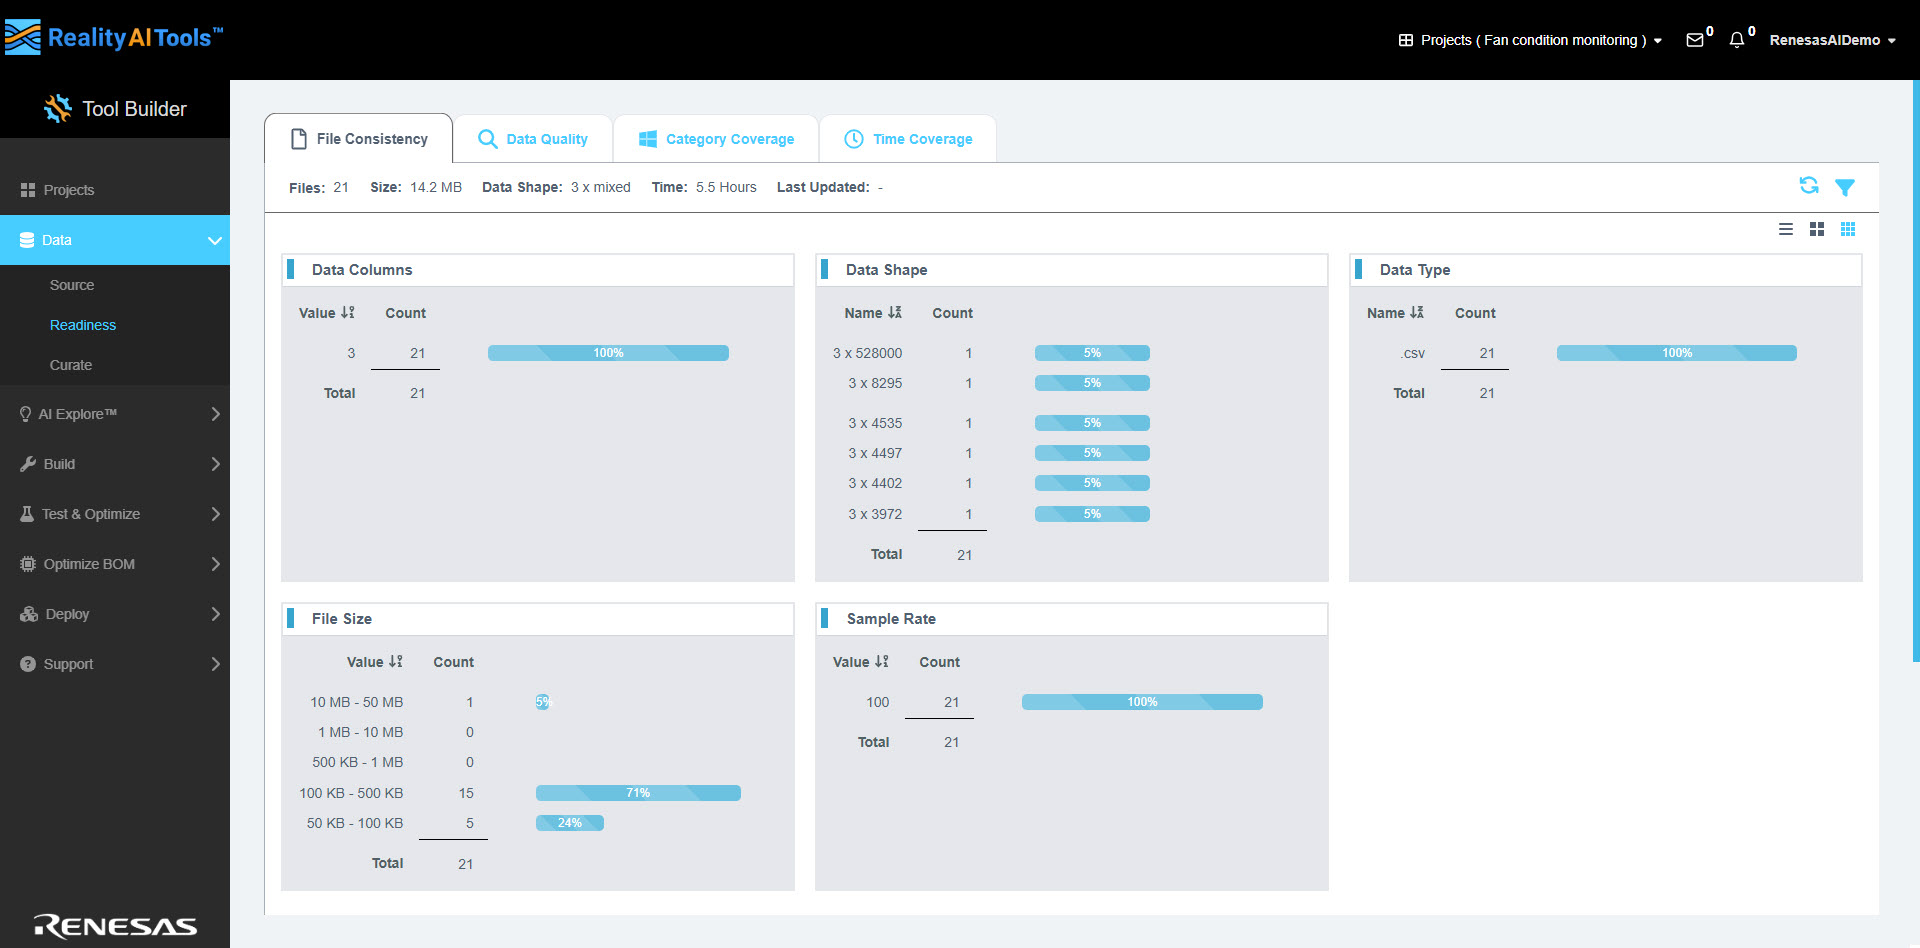
File Consistency
The File Consistency tab provides an overview of your uploaded files and their properties.
Key Features:
- On the right side, you’ll find the Cards tab, where you can customize the display by selecting properties from a dropdown menu.
- The selectable properties are Data Columns, Data Shape, Data Type, File Size, and Sample Rate.
Each selected property is displayed in detail, helping you quickly assess the consistency of your data.
- You can switch between different display modes for better visualization:
- List View
- Large Thumbnails View
- Small Thumbnails View
These options allow you to choose the most convenient format for reviewing file details, ensuring data accuracy and consistency.
Data Quality
The Data Quality tab provides a visual representation of the quality of your uploaded files using a pie chart. This chart categorizes files as either Good or as having File Issues. If any file contains missing sensor data or other discrepancies, the system flags it with a warning, pinpointing the problematic file for your reference.
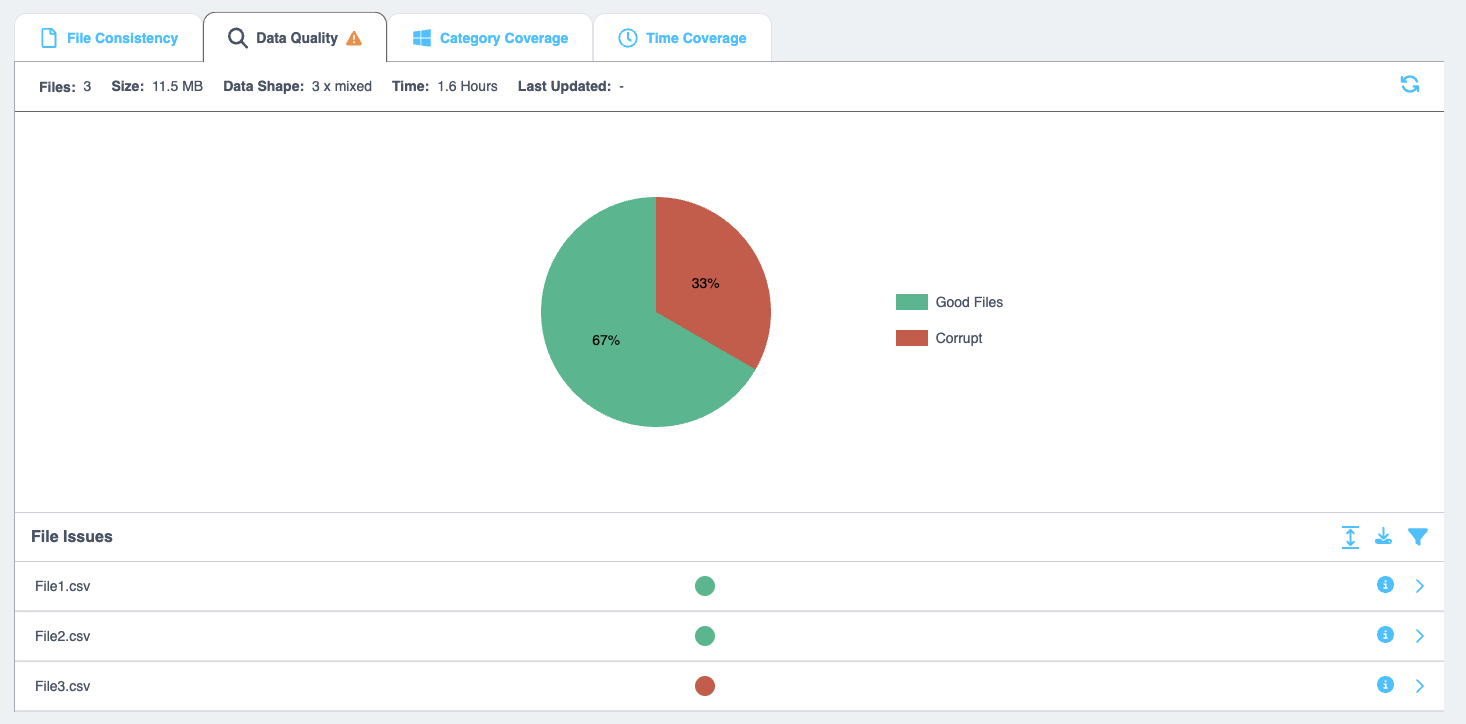
Features of the Data Quality Tab
- Expand All: View a detailed list of file issues.
- Download Icon: Export a CSV file containing the details of all identified file issues for further analysis.
- Filter Icon: Filter file issues based on various criteria, including Name, Data Type, Date, Data Shape, Sample Rate, and Unformatted.
Important Notes
- This tab is for informational purposes only; no direct actions can be taken here.
- Based on the warnings, you can:
- Recheck the problematic files on the Source page.
- Rescan all files from the Readiness page to update the statistics.
- Ignore the flagged data if you decide it’s not critical for model building.
When a sensor is stuck, it repeatedly records the same value without any change in amplitude. The system will issue a warning indicating that a specific channel appears to be stuck and suggesting you check it. This is classified as a warning, not an error, because the behavior might be intentional. If desired, you can bypass the warning.
Category Coverage
The Category Coverage tab provides insights into how your data is distributed and its relationships across different categories. It consists of two sections: Data Distribution and Cross Tabulation.
On the right side, you’ll find the Cards dropdown, where you can customize the display by selecting properties from a dropdown menu.
You can switch between different display modes for better visualization:
- List View
- Large Thumbnails View
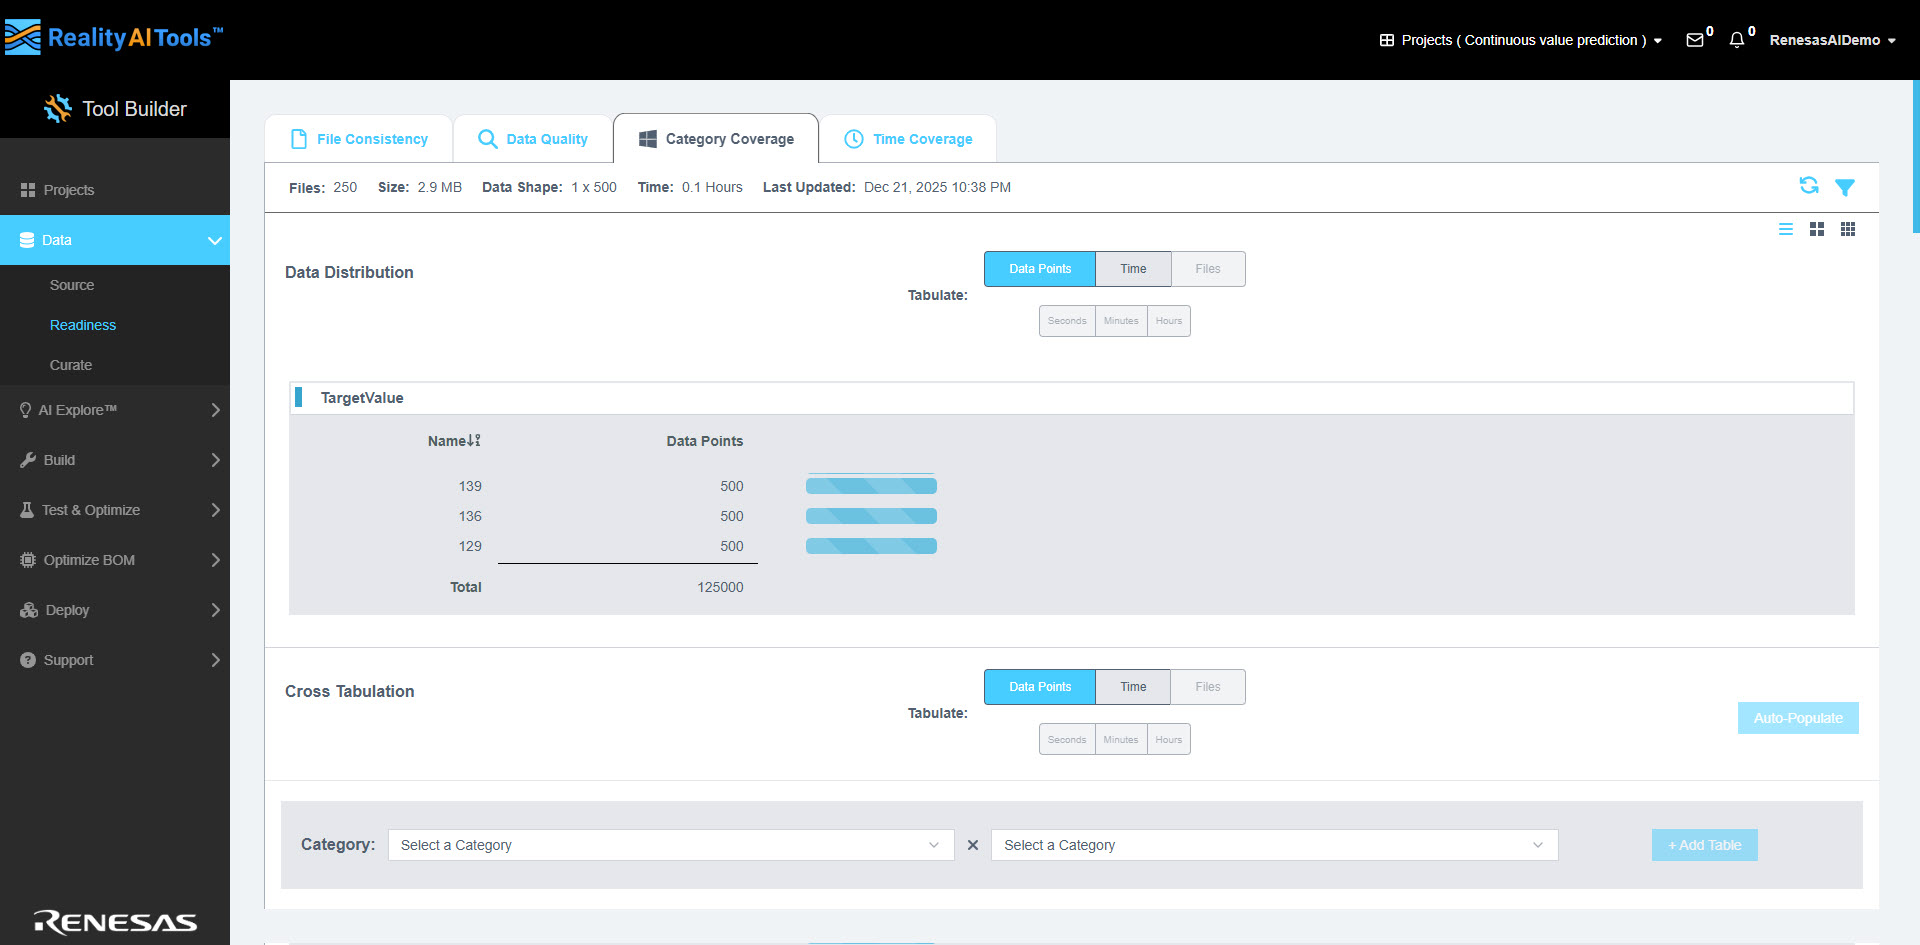
Data Distribution
This section displays the distribution of your data based on the selected metric.
- In the Tabulate field, choose one of the following options:
- Data Points – They are values in the rows in the CSV file.
- Time - Estimated based on the sampling rate.
- Files
- If you select Time, you can further refine your view by choosing the time unit:
- Seconds
- Minutes
- Hours
Cross Tabulation
This section allows you to analyze the relationship between two data sets, metrics or metadata.
- Similar to the Data Distribution section, select a value in the Tabulate field:
- Data Points
- Time
- Files
- If Time is selected, choose a time unit (Seconds, Minutes, or Hours).
- Click Auto-Populate to automatically generate and fill in the tabulated data.
The Tabulate field value must be the same in both Data Distribution and Cross Tabulation sections for accurate analysis.
- In the Category field, select two categories to compare.
- Click the +Add Table button to create a table that displays the comparison as a histogram with cross-tabulation.
- To download the data:
- Click the File icon in the top-right corner.
- Save the information as a .csv file.
- Use the Filter icon to refine the data based on specific criteria.
- Click the Close icon to remove the table from the view.
- Click the Clipboard icon to export the data to your clipboard as an image that can be pasted on your computer.
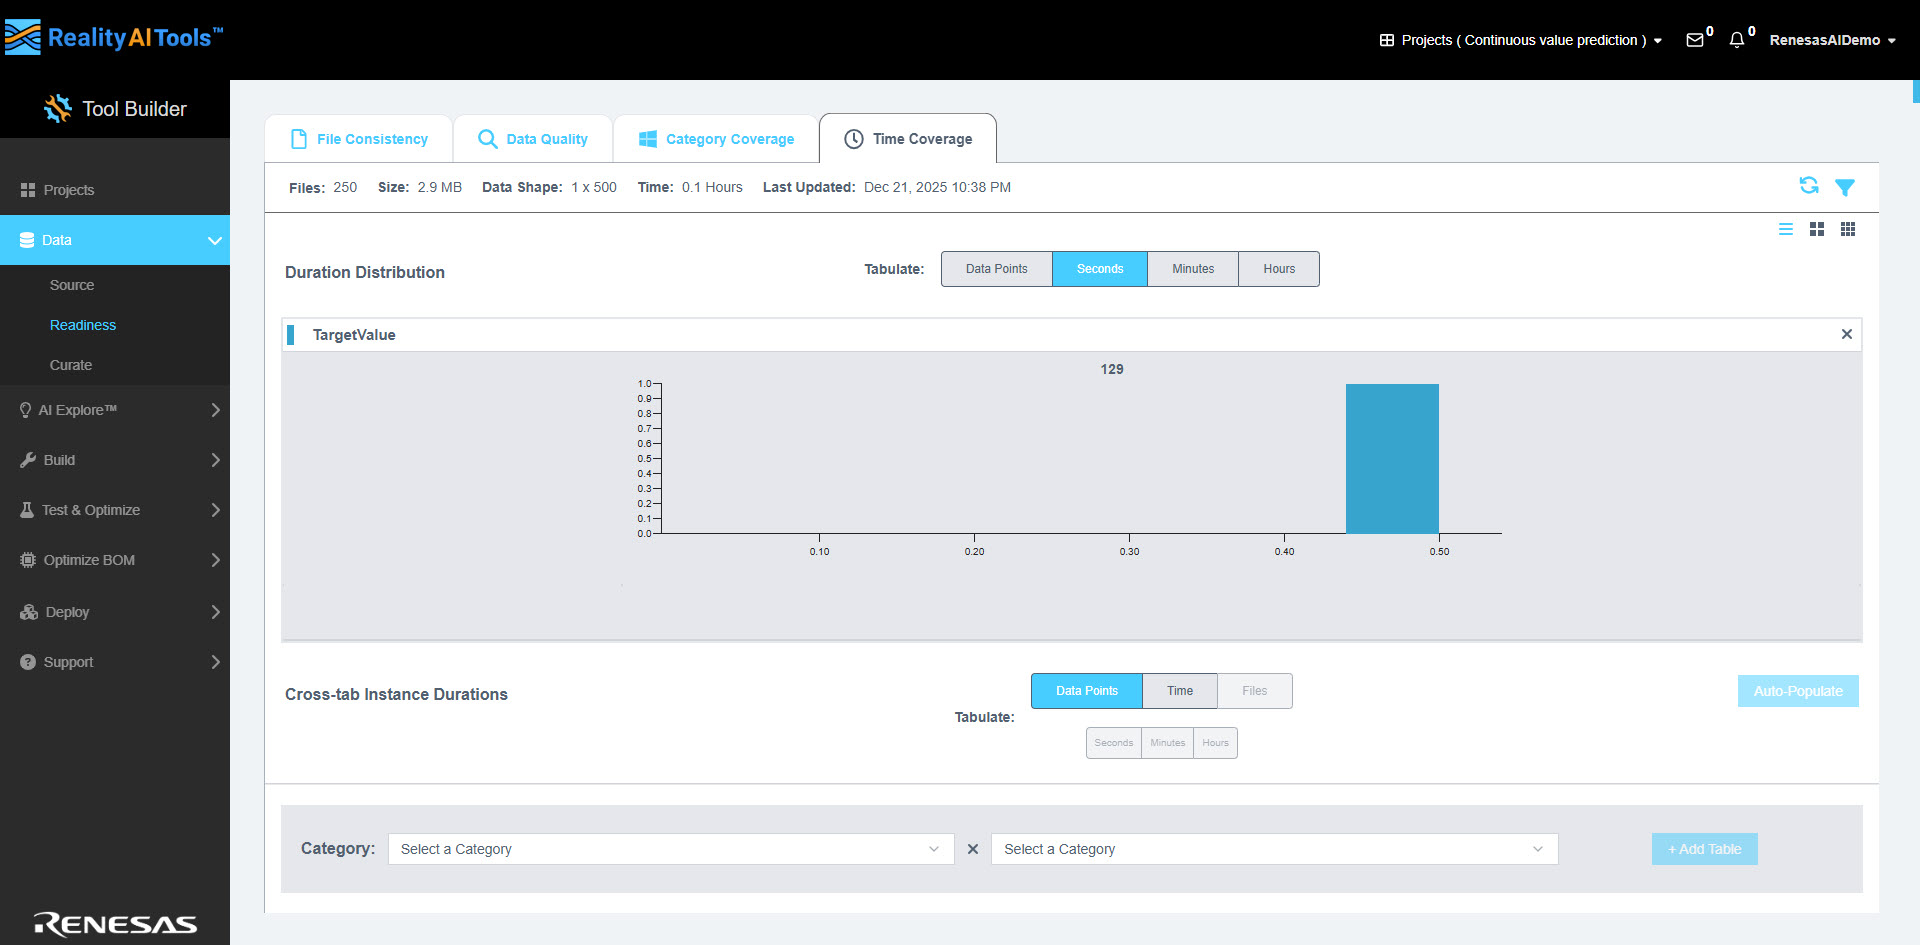
Time Coverage
This provides the distribution of data categories across time. Time Coverage tab has two sections: Duration Distributions and Cross-tab Instance Durations.
On the right side, you’ll find the Cards dropdown, where you can customize the display by selecting properties from a dropdown menu.
You can switch between different display modes for better visualization:
- List View
- Large Thumbnails View
Duration Distributions
In the tabulate field, you have the following options: Data points, Seconds, Minutes and Hours.
In the Cross-tab Instance Durations,
- In the Tabulate field, choose one of the following options:
- Data Points
- Time
- Files
- If you select Time, you can further refine your view by choosing the time unit:
- Seconds
- Minutes
- Hours
Cross-tab Instance Durations
Click Auto-Populate to automatically generate and fill in the tabulated data.
- In the Category field, select two categories to compare.
- Click the +Add Table button to create a table that shows the comparison of the data in the selected time duration.
- To download the data:
- Click the File icon in the top-right corner.
- Save the information as a .csv file.
- Use the Filter icon to refine the data based on specific criteria.
- Click the Close icon to remove the table from the view.
- Click the Clipboard icon to export the data to your clipboard as an image that can be pasted on your computer.